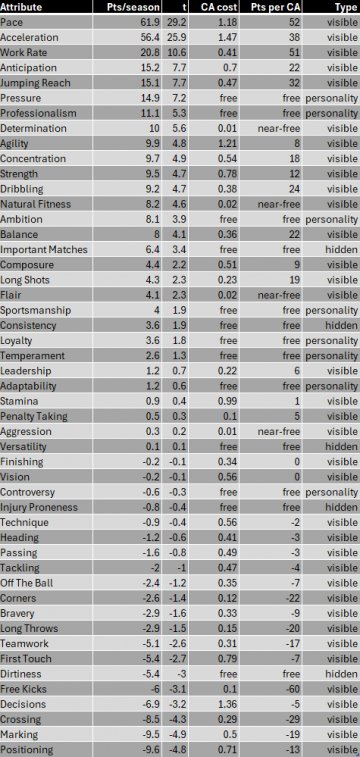
TL;DR: I randomised all 60 attributes of every player in a 20-club league every 75 seconds and let the game holiday through ~16,000 full-engine matches. Pace and Acceleration are worth ~3x anything else. Everything technical measured at or below zero. According to these resutls no attribute has a threshold, they pay linearly 1-20. Once you divide by what a point costs in CA, the best buys are Work Rate, Jumping Reach and the hidden personality attributes, which are (mostly) free.
Method FM's engine is C++ with MSVC RTTI, so every object carries its class name behind the vtable pointer, so you can find every player and scoreline by name instead of hunting offsets. Loop: write a random attribute vector into every squad, sleep 75s while the game holidays, read back and harvest scorelines, repeat every 75s to take into account promoted teams.
Warning that cost me 120,000 matches Match Detail Level decides which simulator runs. On None everything resolves through the Quick Match Engine and effects come out 10x too small in the wrong order. Set the competition to All Competitive Matches. The quick path has its own QME_STAT_MANAGER sitting beside Poisson and Normal distribution objects, so it samples statistics rather than simulating football.
Dataset 15,951 full-engine matches. 47 visible + 5 hidden + 8 personality attributes randomised. CA and PA pinned at 150, morale pinned at 15. Attributes are stored 1-100 and displayed /5; personality attributes sit on a different record at plain 1-20.
Reading the numbers CA is pinned, so ability is a fixed budget and every weight answers "given fixed ability, where is it best spent?" Positioning at -9.6 does not mean Positioning harms you, rather it means CA spent there is not spent on Pace, and that trade costs about 10 points a season.
Validation Fitted on 5,011 matches, tested on 5,011 never used for fitting. Correlation with actual goal difference: Measured weights 0.392; Pace+Acceleration only 0.365; per-position 0.329; CA only 0.318; everything except the speed pair -0.043 Favourable quarter of the test set averages +1.79 goal difference, unfavourable -0.73. A two-segment fit searching every knee from 6 to 16 found no thresholds anywhere.
Global weights, CA cost and value Format: attribute, points per season, (CA cost of one point, points per CA point). CA cost measured separately by ramping a single attribute on an isolated player, R2=0.93. Hidden and personality attributes cost no CA at all. Ratios for near-free attributes are huge because the denominator is tiny, and read those as "free", not as literal multiples. Work Rate is the standout: nearly as valuable as Pace per point of ability, at a third of the cost. Decisions is the worst buy in the game, while the second most expensive attribute and negative. Pressure is worth 14.9 points a season and costs nothing.
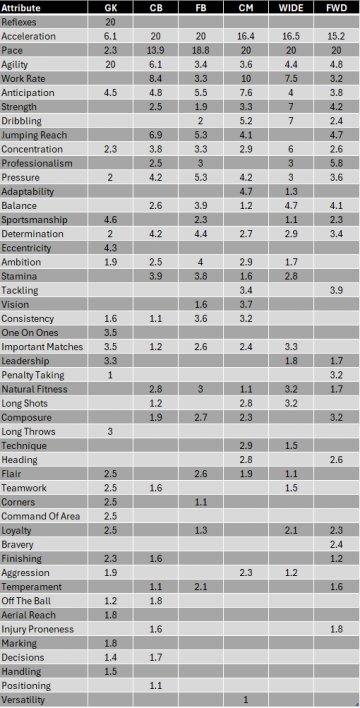
Positional weights (0-20 within each group) Acceleration outranks Pace for CB and FB and the order flips further forward which seems plausible. The positional tables predicted worse out of sample than the pooled one (0.329 vs 0.392).
For goalkeepers, read the top two or three only. Reflexes and Agility separate cleanly; below that it is noise, and Handling ranking under Corners is not a finding. One keeper per match against ten outfielders means that column has about a tenth of the statistical power.
Yes, that seems to be my conclusion on it as well. With this method of reading out data through the code however it's just easier to get a bigger data set. This data set was from an about 8-hour overnight session, but since the output was pretty much in line with the rest of the findings published before, I didn't even bother to let it run for more to be honest.
One thing that my research contradicts though is that I didnt't seem to find any 'knee' for attributes. Where a certain attribute would perform much better than just 1 point lower. I've read some other threads and research that suggest for several attributes a 8 minimum, or you get much less results. Not saying that's not valid, but that type of result didn't really show up for me.
Does your simulation engine has any way of randomizing positional proficiency? (like having your ST being somewhere between ineffective and natural ST)
We have an early view of how it has an impact, but your simulation engine seems very efficient so we might be able to properly (finally!) isolate that.
Also, positionning having such a bad influence on results points toward a problem with the ME. It might try to "position" players in a way it thinks helps, but it makes them play worst. That way, players who are out-of-position are often in an actual better spot than their "better" counterparts. Interesting result to be further investigated.
Panneton0 said: Does your simulation engine has any way of randomizing positional proficiency? (like having your ST being somewhere between ineffective and natural ST)
We have an early view of how it has an impact, but your simulation engine seems very efficient so we might be able to properly (finally!) isolate that.
Amazing work buddy. Expand
Proficiencies are a 15-byte block on the player record (GK, SW, DL, DC, DR, DM, ML, MC, MR, AML, AMC, AMR, ST, WBL, WBR) and I used it to force every club into one formation. (Since the FM26 top tactic table is all the same formation)
The engine does model this explicitly: there's a MATCH_OOP_SCORING_PROVIDER containing OOP_ATTRIBUTE and PITCH_PROXIMITY_SCORE. So the question is magnitude, and worthy of further testing. There are no named entries for in position, so that means that is the baseline or default for ME, and raises the question how important a seperate OOP formation is.
Proficiency only matters via which slot the AI managers actually uses players in. Randomise it without pinning the formation and you measure the penalty plus the AI manager's reaction to a squad of weird random position players. So for efficiency sake, that's why I pinned down the formation first.
Panneton0 said: Also, positionning having such a bad influence on results points toward a problem with the ME. It might try to "position" players in a way it thinks helps, but it makes them play worst. That way, players who are out-of-position are often in an actual better spot than their "better" counterparts. Interesting result to be further investigated. Expand I'd hold off on the ME conclusion just yet, this is again worthy of some more testing. In my test CA is pinned at 150, so every coefficient is opportunity cost, not absolute effect. -9.6 means "CA spent there isn't spent on Pace, and that trade costs ~10 pts/season". It didn't not show that raising Positioning on an unchanged player hurts him. Since I'm not testing on potential, rather current ability in the ME.
Your hypothesis is testable though: let CA float, raise Positioning alone, add nothing back. If it's still negative you're onto something. I'll try run it and report back.
Worth noting Positioning costs 0.71 CA/point, near the top of the cost table. Corners is only -2.6 raw but costs 0.12/point, so it's -22 per CA point vs Positioning's -13. Some of the apparent harm is just an expensive attribute, and if that's at the cost of other less worthy attributes, I doubt it matters a lot for ME outcome calculations.
Great info, that clarifies the test. I'm usually judging attributes without considering the "CA cost". While weird, this is mainly because, when trying to find out what player would be the most efficient in your squad, CA is of no interest.
It is very useful when trying to "buy players", where a badly distributed CA inflates its price. Or for training purposes where the CA-PA gap dictates the progression. But on a matchday, CA is of no importance, only the player effectiveness, which is related to meta attributes, not CA.
So that's why I misunderstood your results. It all makes sense now. Thanks again.
I think the indisputable contribution of this data is that it tells us what matters in FM26, and it seems like there's not much difference to FM24.
I don't know why you're finding every attribute effect to be linear, I think something going wrong somewhere in regards to that. I suspect it could be that you're randomizing attributes of every player at every club in the league, so that there's no longer set levels to compete against (i.e. in a real league, most players will have ~14 pace for example, or most GKs will have ~14 aerial reach, producing thresholds - it's not necessarily innate to the attribute itself, but a product of the relative competition. So 13 > 14 pace isn't a threshold in Vanarama South, but it is in Premier League). It's not entirely clear though if you're randomizing every player at every club, or just one club.
The part that intrigues me the most are the position weights. Have you simply divided the general results by the CA costs for each position, or have you done comparative testing for each position here?
GeorgeFloydOverdosed said: I think the indisputable contribution of this data is that it tells us what matters in FM26, and it seems like there's not much difference to FM24.
I don't know why you're finding every attribute effect to be linear, I think something going wrong somewhere in regards to that. I suspect it could be that you're randomizing attributes of every player at every club in the league, so that there's no longer set levels to compete against (i.e. in a real league, most players will have ~14 pace for example, or most GKs will have ~14 aerial reach, producing thresholds - it's not necessarily innate to the attribute itself, but a product of the relative competition. So 13 > 14 pace isn't a threshold in Vanarama South, but it is in Premier League). It's not entirely clear though if you're randomizing every player at every club, or just one club.
The part that intrigues me the most are the position weights. Have you simply divided the general results by the CA costs for each position, or have you done comparative testing for each position here? Expand I think FM-Arena attribute tests for the past few editions show linear effect for pretty much all of the attributes.
Yarema said: I think FM-Arena attribute tests for the past few editions show linear effect for pretty much all of the attributes. Expand HarvestGreen, Orion, and my own findings don't though.
And the effects can be pretty massive not subtle, for example Orion finds pressure 1 to 10 is +47.33% but pressure 10 to 20 is +10.18%, and HarvestGreen confirmed this with pressure 1 to 6 18.2% and pressure 6 to 18 8.9%. I've found the same.
Yarema said: I think FM-Arena attribute tests for the past few editions show linear effect for pretty much all of the attributes. Expand Many tests published on FM-Arena showed VERY unlinear effect for some attributes.
It's possible that my method of randomized player attribute generation was insufficient to check for a knee in attribute efficiency. It's proving to be much harder to code, but not impossible I believe. But first I will need to wait out the data gathering for a day or two.
tam1236 said: Many tests published on FM-Arena showed VERY unlinear effect for some attributes. Expand
Haha you are hilarious. You are often bold in your statements but wrong. Like when you told Zaz a player couldn't improve. It's really funny. That's correct for some. Yarema and all of us knew this.
Some are useless, even negative..
Some you need a little bit
Some you need a decent amount
And some you want as high as possible. Yes upto 20. But you don't need 20 to win. Just that 20 is still better than 18. For example, as I said above, a player with 20 jumping reach will score 30+ in one season. A player with 17-18 probably won't.
keithb said: Haha you are hilarious. You are often bold in your statements but wrong. Like when you told Zaz a player couldn't improve. It's really funny. That's correct for some. Yarema and all of us knew this.
Some are useless, even negative..
Some you need a little bit
Some you need a decent amount
And some you want as high as possible. Yes upto 20. But you don't need 20 to win. Just that 20 is still better than 18. For example, as I said above, a player with 20 jumping reach will score 30+ in one season. A player with 17-18 probably won't. Expand
THIS
It's not because a % of win don't grow that the value isn't important to high to max. You win against a team with some stats, there is a "wall", but the team can improve.
It's like we're back at school and the thickest kids are the teachers. Bizarre experience. Even got people saying speed isn't that important now. Absolutely crazy
Guys i read all threads about atributes testing ant meta ones... this topic is the most intresting to me and i think i have a question that nobody answers. We found that speed in general is the king, but everytime i start a new save i see that (fm26) first season Harry Kane with speed of turtle is scoring unbelievable amount of goals and is gets player of the year award. So technically is speed is everything how come this happening??? so still plenty theories in my head that maybe for some positions speed is not so overpowered as we all think?
Wigo said: Guys i read all threads about atributes testing ant meta ones... this topic is the most intresting to me and i think i have a question that nobody answers. We found that speed in general is the king, but everytime i start a new save i see that (fm26) first season Harry Kane with speed of turtle is scoring unbelievable amount of goals and is gets player of the year award. So technically is speed is everything how come this happening??? so still plenty theories in my head that maybe for some positions speed is not so overpowered as we all think? Expand Because he is a highly skilled player in a great team that farms the league. Speed is very important but isn't everything. Just as in real life he scores 30 goals per season in Tottenham and 60+ in Bayern
Wigo said: Guys i read all threads about atributes testing ant meta ones... this topic is the most intresting to me and i think i have a question that nobody answers. We found that speed in general is the king, but everytime i start a new save i see that (fm26) first season Harry Kane with speed of turtle is scoring unbelievable amount of goals and is gets player of the year award. So technically is speed is everything how come this happening??? so still plenty theories in my head that maybe for some positions speed is not so overpowered as we all think? Expand I can answer this for you because I'm currently doing isolated testing and analyzing the attribute differences closely for a number of players, and one of them is Harry Kane.
So far my testing finds that Kane is in fact objectively one of top STs in FM24.
I've already come up with a draft set of weights that allows Kane's low acc/pace and other quirks to align smoothly with all other players tested so far, but I'll just tell you a more abstract version of what I'm seeing.
This is my impression so far (for ST at least specifically):
1. Pace/acc, and stamina to keep it going through a game, are still the top factors. 2. Pace/acc is not *strictly* necessary to do well. A player with 9 acceleration can function decently as ST in the Premier League (I've tested this). If you have a team of them, you'll be relegated, but as individual exceptions to the rule they can do the job. Although I haven't tested it, I would expect similar with a team of Harry Kanes. You need at least ~13-14 average for the team as a whole in Premier League just to survive. So pace/acc remains very important. 3. Only about one third of attributes matter. Anticipation and dribbling are in this third for ST, but all of these are at least a bit less crucial than pace/acc. For instance, Messi has 20 dribbling, and while he is not no.1, it does appear to be a key factor in him being one of the top STs according to testing even at age 36 in FM24. None of these attributes are strictly necessary either except perhaps 1 or 2, see: Daizen Maeda 4. This is still dubious, but through analyzing examples such as Kane vs. Lewandowski specifically, it would appear that some attributes such as passing may actually have negative performance impact.
Here is something I already wrote that I was thinking of posting earlier:
There is no reason why Lewandowski should be better than Harry Kane, and yet he is. In fact, Lewandowski is slightly inferior on a number of things.
Lewandowski has advantages in the following areas:
+3 aggression +3 first touch +3 balance +2 anticipation +2 concentration +2 natural fitness +1 bravery +1 off the ball +1 acceleration +1 agility +1 strength +1 important matches
None of those are adequate to explain the difference, given Kane has the following advantages (I'll list just a few):
5 years younger +7 crossing +5 passing +5 vision +4 teamwork +3 left foot +2 consistency +1 determination +1 composure +1 work rate
I suspect that high passing and possibly crossing reduces team performance. Perhaps what is happening in the engine is that Kane is passing to a team-mate do to the job, who is always an inferior player in this case.
---
Note: A possible conclusion of course is that +1 acceleration or +2 anticipation and so forth is just very important, but what you'd be missing is that I'm not just comparing these two players together, I'm comparing them to a dozen others, who each all have to align with the rest of each other, in line with the objective performance results. So if I weight anticipation more say, that would throw 3 others out of whack with each other. There is no simply no way I can see that Lewandowski is better than Kane, and yet after 6 seasons of testing for each, Lewandowski in fact is. The only thing that seems possible is that passing and perhaps other attributes Kane is better in, are having a negative effect on his performance.
Then again, it could be that we just need a few more samples to set things straight. And here we are talking the minor differences of who is say 7th and who is 6th.
Yarema said: I think FM-Arena attribute tests for the past few editions show linear effect for pretty much all of the attributes. Expand keithb said: That's correct for some. Yarema and all of us knew this
Some you need a little bit. Expand I have problem with reading... So they are not linear. Am i right? Or "linear for pretty much all of the attributes"?
tam1236 said: I have problem with reading... So they are not linear. Am i right? Or "linear for pretty much all of the attributes"? Expand
You have a problem with your brain, self awareness and lacking knowledge about FM for sure.
No one thinks positioning is linear. It's useless. When we talk about attribute values being linear we know we are talking about the important attributes and the ones that matter. If you think people are talking about positioning or off the ball then yes I'm sorry you have a problem in the brain. It's fairly common with Bozo and his followers. At times it's like you're all the same person. But it's the internet and everywhere is slowly getting dumbed down. I was really shocked how a lot of Reddit for example went downhill, but now I just expect it. You can't stop it. And now it's made it's way to FM arena.
If you want to argue like a child over semantics carry on. You are still amusing and it will give me a laugh. Another thing Bozo and you do is lie. It's all very infantile. Maybe grow up and try to learn some things, rather than tell very knowledgeable people that they're wrong all the time.
Wigo said: Guys i read all threads about atributes testing ant meta ones... this topic is the most intresting to me and i think i have a question that nobody answers. We found that speed in general is the king, but everytime i start a new save i see that (fm26) first season Harry Kane with speed of turtle is scoring unbelievable amount of goals and is gets player of the year award. So technically is speed is everything how come this happening??? so still plenty theories in my head that maybe for some positions speed is not so overpowered as we all think? Expand
What Yarema said is, obviously, correct. If you play for psg or Bayern they are miles ahead in their leagues. So they will still do well. The rest of the team will carry one or two players easily. Kane will get so many chances he will score loads still. He isn't bad at the start of the game, but if you play long saves then newgens would be miles better.
I mean it's kind of the basis of all these weighting systems, because if a point of pace was vastly different from 9 to 10 as opposed to 15 to 16 there would be no point in having a fixed value for an attribute weight.
So you either accept they are pretty much linear (with a few exceptions) or throw GS ratings out the window.
I mean it's kind of the basis of all these weighting systems, because if a point of pace was vastly different from 9 to 10 as opposed to 15 to 16 there would be no point in having a fixed value for an attribute weight.
So you either accept they are pretty much linear (with a few exceptions) or throw GS ratings out the window. Expand It's not the basis of my weightings, as non-linear values do not make useful weightings in Genie Scout impossible.
Here's how I handle the problem of non-linearity:
Finishing - I know from testing it has no advantage above ~7, and is only of moderate value even below that all the way down to one. Therefore I give it a very low weight, or perhaps even no weight at all.
Work Rate - It's very clear that work rate is crucial going from 1 to 6 but has greatly diminishing returns beyond that, and pretty much tops out at around ~11-13. If you don't believe the testing done on this, just look at player like Haaland, Mbappe and Messi - their work rate is 13, 12, and 9 respectively. The compensation in GS for this is fairly straightforward, instead of weighting Work Rate equal to pace or acc if we were just looking at the 1-to-6 effect, we give it around 20-40 instead of 70-100.
Jumping Reach - This has one of the most difficult curves of all to accommodate. It is very important going from 1 to ~7, then moderately important ~8-13, has a massive jump in performance once going above the league threshold (~14-17 for Premier League), but is then near useless going from ~18 to 20 since probably no other player will challenge above 17 anyway. Here we target either ~8-13 (moderate rating), or the ~14-17 threshold (high rating, perhaps the highest even above pace/acc).
Of course you run into situations where GS considers 1 pace 20 acc equal to 10 pace 10 acc, but those 1 pace 20 acc players are the exceptions not the rule, so it doesn't render the whole enterprize futile.
If an attribute point has a value of 10 from 4 to 5 and 1 from 14 to 15, how exactly do you set a fixed value for scoring in GS? That is the fundamental issue. You need linear scaling at least in the vast majority of values. You can't just say oh it's an average of lets say 3 because it'll be right only in a narrow bracket or maybe even never.
What you can do for attributes that have minimal or no value above a certain point is to set it's value to 0 (or whatever minimal value the calculations show) with a caveat that it only applies above X and that you need to filter for it. I am not disputing that some attributes might act that way, but that assigning them some value (by feel?) is misleading. And again FM-Arena tests showed that going from 18 to 19 to 20 pace is more or less just as valuable, it keeps it's scaling. Can you win with 18? Sure, but 20 is still better.
Yarema said: If an attribute point has a value of 10 from 4 to 5 and 1 from 14 to 15, how exactly do you set a fixed value for scoring in GS? That is the fundamental issue. You need linear scaling at least in the vast majority of values. You can't just say oh it's an average of lets say 3 because it'll be right only in a narrow bracket or maybe even never.
What you can do for attributes that have minimal or no value above a certain point is to set it's value to 0 (or whatever minimal value the calculations show) with a caveat that it only applies above X and that you need to filter for it. I am not disputing that some attributes might act that way, but that assigning them some value (by feel?) is misleading. And again FM-Arena tests showed that going from 18 to 19 to 20 pace is more or less just as valuable, it keeps it's scaling. Can you win with 18? Sure, but 20 is still better. Expand With respect, my post was my answer to that very question.
You could argue the method is inadequate, but you can't say it achieves nothing at all, and I'd challenge you with the following question: If not this method, then what? Assume attributes are linear and get assessments that are even more wrong?
It's true that filters can be part of the solution, and I've suggested to people before to use filters in combination with GS weightings if they can, but obviously this isn't a very good solution. Filtering is too blunt a tool for one thing; it's better to use weighted weightings instead usually.
I don't believe in FM Arena testing much, because they obviously contradict the findings of HarvestGreen, Orion, and myself. Even aside from the results, I didn't like some of the methodology that I could see, in the same way that I don't like how HarvestGreen uses an artificial league where everybody has the same attributes, instead of using a real league like the Premier League.
We see something similar reveal itself in this guy's testing. I would characterize it as a kind of blase 'let's apply a python script to this' mentality. Sometimes, the kind of info that gets can be very useful, but I think more typically it leads to skipping over the necessary nuances that only someone who has waded deep into it with hours of trial and error and reflection and critical thought can discern.
For example, he says his results show that attributes are linear. Ok, so why hasn't he reflected and deduced why this contradicts HarvestGreen's findings? The most likely answer is that he simply hasn't put in the time in doing that. By his own account the data was from an '8 hour overnight session', and I don't know how long he spent on it overall, but my impression is that this is probably something he's done over a week or two.
I'm not trying to throw shade, and it's no crime to not spend your life on analyzing FM, I'm just saying it's an approach that has certain downsides. My downsides are that I'm not a programmer, so I can't use such a methodical and fast approach, and because I'm always coming up with different ideas, I don't say 'this is the result I got, that's it from me'.
Now you say that assigning values by feel is misleading. Well let's look at a concrete example:
I brute force test players until I know who ranks where.
Starting with informed guesses (i.e. start pace at '100' not '0', and passing at '0' not '100' ), I adjust the weightings in Genie Scout until the player rankings all correspond exactly to their actual performance ranking.
Because some or many attributes are not linear, there may be a 1% error here, a 3% error there, and even a handful of ranks out of the thousands out of alignment, but for the most part, it does its job.
I could continue the example further, but I think the point is already clear - where exactly is the error or impossibility in it?
keithb said: 20 jumping reach at corners for a season is significantly better than 17.
*amateur testers may say different. Expand
Did you find JR to be the only thing that matters on corners? I had a newgen with 20 JR, 14 STR and something like 3 heading. He scored nowhere near as much as a CB with 17 JR, 17 STR, 15 heading. Anecdotal, sure. And I dropped that save, so I can't tell you if that season was a fluke or the norm. Still, on corners at least, JR doesn't look like the whole story for aerial threat.
TL;DR: I randomised all 60 attributes of every player in a 20-club league every 75 seconds and let the game holiday through ~16,000 full-engine matches.
Pace and Acceleration are worth ~3x anything else.
Everything technical measured at or below zero.
According to these resutls no attribute has a threshold, they pay linearly 1-20.
Once you divide by what a point costs in CA, the best buys are Work Rate, Jumping Reach and the hidden personality attributes, which are (mostly) free.
Method
FM's engine is C++ with MSVC RTTI, so every object carries its class name behind the vtable pointer, so you can find every player and scoreline by name instead of hunting offsets.
Loop: write a random attribute vector into every squad, sleep 75s while the game holidays, read back and harvest scorelines, repeat every 75s to take into account promoted teams.
Warning that cost me 120,000 matches
Match Detail Level decides which simulator runs.
On None everything resolves through the Quick Match Engine and effects come out 10x too small in the wrong order. Set the competition to All Competitive Matches.
The quick path has its own QME_STAT_MANAGER sitting beside Poisson and Normal distribution objects, so it samples statistics rather than simulating football.
Dataset
15,951 full-engine matches.
47 visible + 5 hidden + 8 personality attributes randomised.
CA and PA pinned at 150, morale pinned at 15.
Attributes are stored 1-100 and displayed /5;
personality attributes sit on a different record at plain 1-20.
Reading the numbers
CA is pinned, so ability is a fixed budget and every weight answers "given fixed ability, where is it best spent?"
Positioning at -9.6 does not mean Positioning harms you, rather it means CA spent there is not spent on Pace, and that trade costs about 10 points a season.
Validation
Fitted on 5,011 matches, tested on 5,011 never used for fitting.
Correlation with actual goal difference:
Measured weights 0.392; Pace+Acceleration only 0.365; per-position 0.329; CA only 0.318; everything except the speed pair -0.043
Favourable quarter of the test set averages +1.79 goal difference, unfavourable -0.73.
A two-segment fit searching every knee from 6 to 16 found no thresholds anywhere.
Global weights, CA cost and value
Format: attribute, points per season, (CA cost of one point, points per CA point).
CA cost measured separately by ramping a single attribute on an isolated player, R2=0.93.
Hidden and personality attributes cost no CA at all.
Ratios for near-free attributes are huge because the denominator is tiny, and read those as "free", not as literal multiples.
Work Rate is the standout: nearly as valuable as Pace per point of ability, at a third of the cost. Decisions is the worst buy in the game, while the second most expensive attribute and negative.
Pressure is worth 14.9 points a season and costs nothing.
Positional weights (0-20 within each group)
Acceleration outranks Pace for CB and FB and the order flips further forward which seems plausible.
The positional tables predicted worse out of sample than the pooled one (0.329 vs 0.392).
For goalkeepers, read the top two or three only.
Reflexes and Agility separate cleanly; below that it is noise, and Handling ranking under Corners is not a finding.
One keeper per match against ten outfielders means that column has about a tenth of the statistical power.
Shout out
to mavarobli / mavali / mark17072
@https://fm-arena.com/thread/20087-fmsuperscout-free-open-source-scouting-tool-for-fm26-with-a-meta-score-built-on-fm-arena-attribute-testing/
I've had a quick look on the result and it's inline with the FM-Arena Attribute testing for FM24 - https://fm-arena.com/thread/14009-attribute-testing-football-manager-24/
Lapidus said: I've had a quick look on the result and it's inline with the FM-Arena Attribute testing for FM24 - https://fm-arena.com/thread/14009-attribute-testing-football-manager-24/
Yes, that seems to be my conclusion on it as well.
With this method of reading out data through the code however it's just easier to get a bigger data set.
This data set was from an about 8-hour overnight session, but since the output was pretty much in line with the rest of the findings published before, I didn't even bother to let it run for more to be honest.
One thing that my research contradicts though is that I didnt't seem to find any 'knee' for attributes.
Where a certain attribute would perform much better than just 1 point lower.
I've read some other threads and research that suggest for several attributes a 8 minimum, or you get much less results.
Not saying that's not valid, but that type of result didn't really show up for me.
Does your simulation engine has any way of randomizing positional proficiency? (like having your ST being somewhere between ineffective and natural ST)
We have an early view of how it has an impact, but your simulation engine seems very efficient so we might be able to properly (finally!) isolate that.
Amazing work buddy.
Also, positionning having such a bad influence on results points toward a problem with the ME. It might try to "position" players in a way it thinks helps, but it makes them play worst. That way, players who are out-of-position are often in an actual better spot than their "better" counterparts. Interesting result to be further investigated.
Panneton0 said: Does your simulation engine has any way of randomizing positional proficiency? (like having your ST being somewhere between ineffective and natural ST)
We have an early view of how it has an impact, but your simulation engine seems very efficient so we might be able to properly (finally!) isolate that.
Amazing work buddy.
Proficiencies are a 15-byte block on the player record (GK, SW, DL, DC, DR, DM, ML, MC, MR, AML, AMC, AMR, ST, WBL, WBR) and I used it to force every club into one formation. (Since the FM26 top tactic table is all the same formation)
The engine does model this explicitly: there's a MATCH_OOP_SCORING_PROVIDER containing OOP_ATTRIBUTE and PITCH_PROXIMITY_SCORE. So the question is magnitude, and worthy of further testing.
There are no named entries for in position, so that means that is the baseline or default for ME, and raises the question how important a seperate OOP formation is.
Proficiency only matters via which slot the AI managers actually uses players in.
Randomise it without pinning the formation and you measure the penalty plus the AI manager's reaction to a squad of weird random position players.
So for efficiency sake, that's why I pinned down the formation first.
Panneton0 said: Also, positionning having such a bad influence on results points toward a problem with the ME. It might try to "position" players in a way it thinks helps, but it makes them play worst. That way, players who are out-of-position are often in an actual better spot than their "better" counterparts. Interesting result to be further investigated.
I'd hold off on the ME conclusion just yet, this is again worthy of some more testing.
In my test CA is pinned at 150, so every coefficient is opportunity cost, not absolute effect.
-9.6 means "CA spent there isn't spent on Pace, and that trade costs ~10 pts/season".
It didn't not show that raising Positioning on an unchanged player hurts him.
Since I'm not testing on potential, rather current ability in the ME.
Your hypothesis is testable though: let CA float, raise Positioning alone, add nothing back.
If it's still negative you're onto something.
I'll try run it and report back.
Worth noting Positioning costs 0.71 CA/point, near the top of the cost table.
Corners is only -2.6 raw but costs 0.12/point, so it's -22 per CA point vs Positioning's -13.
Some of the apparent harm is just an expensive attribute, and if that's at the cost of other less worthy attributes, I doubt it matters a lot for ME outcome calculations.
Great info, that clarifies the test. I'm usually judging attributes without considering the "CA cost". While weird, this is mainly because, when trying to find out what player would be the most efficient in your squad, CA is of no interest.
It is very useful when trying to "buy players", where a badly distributed CA inflates its price. Or for training purposes where the CA-PA gap dictates the progression. But on a matchday, CA is of no importance, only the player effectiveness, which is related to meta attributes, not CA.
So that's why I misunderstood your results. It all makes sense now. Thanks again.
I think the indisputable contribution of this data is that it tells us what matters in FM26, and it seems like there's not much difference to FM24.
I don't know why you're finding every attribute effect to be linear, I think something going wrong somewhere in regards to that. I suspect it could be that you're randomizing attributes of every player at every club in the league, so that there's no longer set levels to compete against (i.e. in a real league, most players will have ~14 pace for example, or most GKs will have ~14 aerial reach, producing thresholds - it's not necessarily innate to the attribute itself, but a product of the relative competition. So 13 > 14 pace isn't a threshold in Vanarama South, but it is in Premier League). It's not entirely clear though if you're randomizing every player at every club, or just one club.
The part that intrigues me the most are the position weights. Have you simply divided the general results by the CA costs for each position, or have you done comparative testing for each position here?
Here is a GS files.
I've shared a file like this weeks ago, it's near the old file, but your work is more precise. Hope the file will share more accurate things.
Important to note: ratings and position are made for Zaz 4.5 Autumn, no ratings for libero or defensive mid for example.
With the old file, won everything each season with underdog or top club. With this new file, let's play and test !
https://limewire.com/d/CCdE4#9Z2IjDC1iF
GeorgeFloydOverdosed said: I think the indisputable contribution of this data is that it tells us what matters in FM26, and it seems like there's not much difference to FM24.
I don't know why you're finding every attribute effect to be linear, I think something going wrong somewhere in regards to that. I suspect it could be that you're randomizing attributes of every player at every club in the league, so that there's no longer set levels to compete against (i.e. in a real league, most players will have ~14 pace for example, or most GKs will have ~14 aerial reach, producing thresholds - it's not necessarily innate to the attribute itself, but a product of the relative competition. So 13 > 14 pace isn't a threshold in Vanarama South, but it is in Premier League). It's not entirely clear though if you're randomizing every player at every club, or just one club.
The part that intrigues me the most are the position weights. Have you simply divided the general results by the CA costs for each position, or have you done comparative testing for each position here?
I think FM-Arena attribute tests for the past few editions show linear effect for pretty much all of the attributes.
Yarema said: I think FM-Arena attribute tests for the past few editions show linear effect for pretty much all of the attributes.
The difference of someone with 20 jumping reach at corners is pretty big.
I made GS file too. Is based on @Gerrard aka Knap initial post in the SI Forum. Feel free to test and give feedback.
Just rename to .grf
Yarema said: I think FM-Arena attribute tests for the past few editions show linear effect for pretty much all of the attributes.
HarvestGreen, Orion, and my own findings don't though.
And the effects can be pretty massive not subtle, for example Orion finds pressure 1 to 10 is +47.33% but pressure 10 to 20 is +10.18%, and HarvestGreen confirmed this with pressure 1 to 6 18.2% and pressure 6 to 18 8.9%. I've found the same.
Yarema said: I think FM-Arena attribute tests for the past few editions show linear effect for pretty much all of the attributes.
Many tests published on FM-Arena showed VERY unlinear effect for some attributes.
It's possible that my method of randomized player attribute generation was insufficient to check for a knee in attribute efficiency.
It's proving to be much harder to code, but not impossible I believe.
But first I will need to wait out the data gathering for a day or two.
tam1236 said: Many tests published on FM-Arena showed VERY unlinear effect for some attributes.
Haha you are hilarious. You are often bold in your statements but wrong. Like when you told Zaz a player couldn't improve. It's really funny. That's correct for some. Yarema and all of us knew this.
Some are useless, even negative..
Some you need a little bit
Some you need a decent amount
And some you want as high as possible. Yes upto 20. But you don't need 20 to win. Just that 20 is still better than 18. For example, as I said above, a player with 20 jumping reach will score 30+ in one season. A player with 17-18 probably won't.
keithb said: Haha you are hilarious. You are often bold in your statements but wrong. Like when you told Zaz a player couldn't improve. It's really funny. That's correct for some. Yarema and all of us knew this.
Some are useless, even negative..
Some you need a little bit
Some you need a decent amount
And some you want as high as possible. Yes upto 20. But you don't need 20 to win. Just that 20 is still better than 18. For example, as I said above, a player with 20 jumping reach will score 30+ in one season. A player with 17-18 probably won't.
THIS
It's not because a % of win don't grow that the value isn't important to high to max. You win against a team with some stats, there is a "wall", but the team can improve.
It's like we're back at school and the thickest kids are the teachers. Bizarre experience. Even got people saying speed isn't that important now. Absolutely crazy
Guys i read all threads about atributes testing ant meta ones... this topic is the most intresting to me and i think i have a question that nobody answers. We found that speed in general is the king, but everytime i start a new save i see that (fm26) first season Harry Kane with speed of turtle is scoring unbelievable amount of goals and is gets player of the year award. So technically is speed is everything how come this happening??? so still plenty theories in my head that maybe for some positions speed is not so overpowered as we all think?
Wigo said: Guys i read all threads about atributes testing ant meta ones... this topic is the most intresting to me and i think i have a question that nobody answers. We found that speed in general is the king, but everytime i start a new save i see that (fm26) first season Harry Kane with speed of turtle is scoring unbelievable amount of goals and is gets player of the year award. So technically is speed is everything how come this happening??? so still plenty theories in my head that maybe for some positions speed is not so overpowered as we all think?
Because he is a highly skilled player in a great team that farms the league. Speed is very important but isn't everything. Just as in real life he scores 30 goals per season in Tottenham and 60+ in Bayern
Wigo said: Guys i read all threads about atributes testing ant meta ones... this topic is the most intresting to me and i think i have a question that nobody answers. We found that speed in general is the king, but everytime i start a new save i see that (fm26) first season Harry Kane with speed of turtle is scoring unbelievable amount of goals and is gets player of the year award. So technically is speed is everything how come this happening??? so still plenty theories in my head that maybe for some positions speed is not so overpowered as we all think?
I can answer this for you because I'm currently doing isolated testing and analyzing the attribute differences closely for a number of players, and one of them is Harry Kane.
So far my testing finds that Kane is in fact objectively one of top STs in FM24.
I've already come up with a draft set of weights that allows Kane's low acc/pace and other quirks to align smoothly with all other players tested so far, but I'll just tell you a more abstract version of what I'm seeing.
This is my impression so far (for ST at least specifically):
1. Pace/acc, and stamina to keep it going through a game, are still the top factors.
2. Pace/acc is not *strictly* necessary to do well. A player with 9 acceleration can function decently as ST in the Premier League (I've tested this). If you have a team of them, you'll be relegated, but as individual exceptions to the rule they can do the job. Although I haven't tested it, I would expect similar with a team of Harry Kanes. You need at least ~13-14 average for the team as a whole in Premier League just to survive. So pace/acc remains very important.
3. Only about one third of attributes matter. Anticipation and dribbling are in this third for ST, but all of these are at least a bit less crucial than pace/acc. For instance, Messi has 20 dribbling, and while he is not no.1, it does appear to be a key factor in him being one of the top STs according to testing even at age 36 in FM24. None of these attributes are strictly necessary either except perhaps 1 or 2, see: Daizen Maeda
4. This is still dubious, but through analyzing examples such as Kane vs. Lewandowski specifically, it would appear that some attributes such as passing may actually have negative performance impact.
Here is something I already wrote that I was thinking of posting earlier:
There is no reason why Lewandowski should be better than Harry Kane, and yet he is. In fact, Lewandowski is slightly inferior on a number of things.
Lewandowski has advantages in the following areas:
+3 aggression
+3 first touch
+3 balance
+2 anticipation
+2 concentration
+2 natural fitness
+1 bravery
+1 off the ball
+1 acceleration
+1 agility
+1 strength
+1 important matches
None of those are adequate to explain the difference, given Kane has the following advantages (I'll list just a few):
5 years younger
+7 crossing
+5 passing
+5 vision
+4 teamwork
+3 left foot
+2 consistency
+1 determination
+1 composure
+1 work rate
I suspect that high passing and possibly crossing reduces team performance. Perhaps what is happening in the engine is that Kane is passing to a team-mate do to the job, who is always an inferior player in this case.
---
Note: A possible conclusion of course is that +1 acceleration or +2 anticipation and so forth is just very important, but what you'd be missing is that I'm not just comparing these two players together, I'm comparing them to a dozen others, who each all have to align with the rest of each other, in line with the objective performance results. So if I weight anticipation more say, that would throw 3 others out of whack with each other. There is no simply no way I can see that Lewandowski is better than Kane, and yet after 6 seasons of testing for each, Lewandowski in fact is. The only thing that seems possible is that passing and perhaps other attributes Kane is better in, are having a negative effect on his performance.
Then again, it could be that we just need a few more samples to set things straight. And here we are talking the minor differences of who is say 7th and who is 6th.
Yarema said: I think FM-Arena attribute tests for the past few editions show linear effect for pretty much all of the attributes.
keithb said: That's correct for some. Yarema and all of us knew this
Some you need a little bit.
I have problem with reading...
So they are not linear. Am i right? Or "linear for pretty much all of the attributes"?
tam1236 said: I have problem with reading...
So they are not linear. Am i right? Or "linear for pretty much all of the attributes"?
You have a problem with your brain, self awareness and lacking knowledge about FM for sure.
No one thinks positioning is linear. It's useless. When we talk about attribute values being linear we know we are talking about the important attributes and the ones that matter. If you think people are talking about positioning or off the ball then yes I'm sorry you have a problem in the brain. It's fairly common with Bozo and his followers. At times it's like you're all the same person. But it's the internet and everywhere is slowly getting dumbed down. I was really shocked how a lot of Reddit for example went downhill, but now I just expect it. You can't stop it. And now it's made it's way to FM arena.
If you want to argue like a child over semantics carry on. You are still amusing and it will give me a laugh. Another thing Bozo and you do is lie. It's all very infantile. Maybe grow up and try to learn some things, rather than tell very knowledgeable people that they're wrong all the time.
Wigo said: Guys i read all threads about atributes testing ant meta ones... this topic is the most intresting to me and i think i have a question that nobody answers. We found that speed in general is the king, but everytime i start a new save i see that (fm26) first season Harry Kane with speed of turtle is scoring unbelievable amount of goals and is gets player of the year award. So technically is speed is everything how come this happening??? so still plenty theories in my head that maybe for some positions speed is not so overpowered as we all think?
What Yarema said is, obviously, correct. If you play for psg or Bayern they are miles ahead in their leagues. So they will still do well. The rest of the team will carry one or two players easily. Kane will get so many chances he will score loads still. He isn't bad at the start of the game, but if you play long saves then newgens would be miles better.
Beware of false prophets and shoddy testing.
tam1236 said: I have problem with reading...
So they are not linear. Am i right? Or "linear for pretty much all of the attributes"?
https://fm-arena.com/find-comment/40302/
I mean it's kind of the basis of all these weighting systems, because if a point of pace was vastly different from 9 to 10 as opposed to 15 to 16 there would be no point in having a fixed value for an attribute weight.
So you either accept they are pretty much linear (with a few exceptions) or throw GS ratings out the window.
Yarema said: https://fm-arena.com/find-comment/40302/
I mean it's kind of the basis of all these weighting systems, because if a point of pace was vastly different from 9 to 10 as opposed to 15 to 16 there would be no point in having a fixed value for an attribute weight.
So you either accept they are pretty much linear (with a few exceptions) or throw GS ratings out the window.
It's not the basis of my weightings, as non-linear values do not make useful weightings in Genie Scout impossible.
Here's how I handle the problem of non-linearity:
Finishing - I know from testing it has no advantage above ~7, and is only of moderate value even below that all the way down to one. Therefore I give it a very low weight, or perhaps even no weight at all.
Work Rate - It's very clear that work rate is crucial going from 1 to 6 but has greatly diminishing returns beyond that, and pretty much tops out at around ~11-13. If you don't believe the testing done on this, just look at player like Haaland, Mbappe and Messi - their work rate is 13, 12, and 9 respectively. The compensation in GS for this is fairly straightforward, instead of weighting Work Rate equal to pace or acc if we were just looking at the 1-to-6 effect, we give it around 20-40 instead of 70-100.
Jumping Reach - This has one of the most difficult curves of all to accommodate. It is very important going from 1 to ~7, then moderately important ~8-13, has a massive jump in performance once going above the league threshold (~14-17 for Premier League), but is then near useless going from ~18 to 20 since probably no other player will challenge above 17 anyway. Here we target either ~8-13 (moderate rating), or the ~14-17 threshold (high rating, perhaps the highest even above pace/acc).
Of course you run into situations where GS considers 1 pace 20 acc equal to 10 pace 10 acc, but those 1 pace 20 acc players are the exceptions not the rule, so it doesn't render the whole enterprize futile.
If an attribute point has a value of 10 from 4 to 5 and 1 from 14 to 15, how exactly do you set a fixed value for scoring in GS? That is the fundamental issue. You need linear scaling at least in the vast majority of values. You can't just say oh it's an average of lets say 3 because it'll be right only in a narrow bracket or maybe even never.
What you can do for attributes that have minimal or no value above a certain point is to set it's value to 0 (or whatever minimal value the calculations show) with a caveat that it only applies above X and that you need to filter for it. I am not disputing that some attributes might act that way, but that assigning them some value (by feel?) is misleading. And again FM-Arena tests showed that going from 18 to 19 to 20 pace is more or less just as valuable, it keeps it's scaling. Can you win with 18? Sure, but 20 is still better.
20 jumping reach at corners for a season is significantly better than 17.
*amateur testers may say different.
Yarema said: If an attribute point has a value of 10 from 4 to 5 and 1 from 14 to 15, how exactly do you set a fixed value for scoring in GS? That is the fundamental issue. You need linear scaling at least in the vast majority of values. You can't just say oh it's an average of lets say 3 because it'll be right only in a narrow bracket or maybe even never.
What you can do for attributes that have minimal or no value above a certain point is to set it's value to 0 (or whatever minimal value the calculations show) with a caveat that it only applies above X and that you need to filter for it. I am not disputing that some attributes might act that way, but that assigning them some value (by feel?) is misleading. And again FM-Arena tests showed that going from 18 to 19 to 20 pace is more or less just as valuable, it keeps it's scaling. Can you win with 18? Sure, but 20 is still better.
With respect, my post was my answer to that very question.
You could argue the method is inadequate, but you can't say it achieves nothing at all, and I'd challenge you with the following question: If not this method, then what? Assume attributes are linear and get assessments that are even more wrong?
It's true that filters can be part of the solution, and I've suggested to people before to use filters in combination with GS weightings if they can, but obviously this isn't a very good solution. Filtering is too blunt a tool for one thing; it's better to use weighted weightings instead usually.
I don't believe in FM Arena testing much, because they obviously contradict the findings of HarvestGreen, Orion, and myself. Even aside from the results, I didn't like some of the methodology that I could see, in the same way that I don't like how HarvestGreen uses an artificial league where everybody has the same attributes, instead of using a real league like the Premier League.
We see something similar reveal itself in this guy's testing. I would characterize it as a kind of blase 'let's apply a python script to this' mentality. Sometimes, the kind of info that gets can be very useful, but I think more typically it leads to skipping over the necessary nuances that only someone who has waded deep into it with hours of trial and error and reflection and critical thought can discern.
For example, he says his results show that attributes are linear. Ok, so why hasn't he reflected and deduced why this contradicts HarvestGreen's findings? The most likely answer is that he simply hasn't put in the time in doing that. By his own account the data was from an '8 hour overnight session', and I don't know how long he spent on it overall, but my impression is that this is probably something he's done over a week or two.
I'm not trying to throw shade, and it's no crime to not spend your life on analyzing FM, I'm just saying it's an approach that has certain downsides. My downsides are that I'm not a programmer, so I can't use such a methodical and fast approach, and because I'm always coming up with different ideas, I don't say 'this is the result I got, that's it from me'.
Now you say that assigning values by feel is misleading. Well let's look at a concrete example:
I brute force test players until I know who ranks where.
Starting with informed guesses (i.e. start pace at '100' not '0', and passing at '0' not '100' ), I adjust the weightings in Genie Scout until the player rankings all correspond exactly to their actual performance ranking.
Because some or many attributes are not linear, there may be a 1% error here, a 3% error there, and even a handful of ranks out of the thousands out of alignment, but for the most part, it does its job.
I could continue the example further, but I think the point is already clear - where exactly is the error or impossibility in it?
keithb said: 20 jumping reach at corners for a season is significantly better than 17.
*amateur testers may say different.
Did you find JR to be the only thing that matters on corners? I had a newgen with 20 JR, 14 STR and something like 3 heading. He scored nowhere near as much as a CB with 17 JR, 17 STR, 15 heading. Anecdotal, sure. And I dropped that save, so I can't tell you if that season was a fluke or the norm. Still, on corners at least, JR doesn't look like the whole story for aerial threat.