Exellent said: Hey, I tested your latest rating build, and it’s a complete disaster.
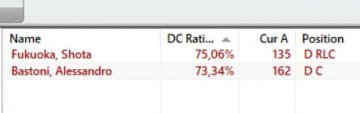
your super rating says that Shota Fukuoka is better than Bastoni. Spoiler Expand
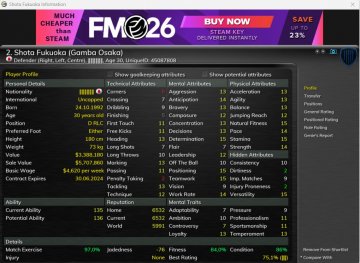
I've inputted the stats shown for Fukuoka into FM24. I ended up with 131 instead of 135 CA, probably because of some lacking DL/DR/weak foot proficiency, but that's no issue. The only other difference is that I've changed Fukuoka's nation to England, so that his low adaptability doesn't mess with things.
Here is the result:
82% | Kim Min Jae (DC) - 3rd, 3rd, 6th, 6th, 3rd, 4th, 5th = 4.286 position 75% | Kurt Zouma (DC) - 7th, 5th, 6th, 3rd = 5.6 position 73% | Shota Fukuoka (DC) [Exellent version] = 7th, 8th, 7th, 8th, 8th, 11th = 8.166 position 71% | Sean Goldberg (DC) - 5th, 16th (sacked), 8th (sacked), 5th = 8.5 position
I'm using the FMST26 % as that is more accurate and what I always refer to, but you can see the difference is only 73% vs 75% anyway.
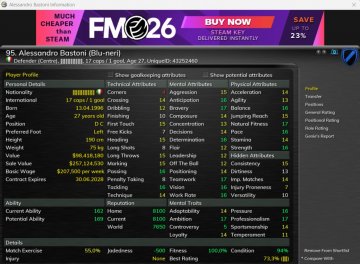
Kurt Zouma is quite similar to Bastoni if you compare the stats:
But I will also do a clone of Bastoni for comparison so that there's no doubt about it.
This is all a good test of my claims, because this way no one can say it's only valid for cherrypicked players.
While I'm doing Bastoni I do notice that he is actually 77.9% in FMST26, for FM24 (where he has largely the same stats). Anyone can verify this by loading up FMST26 with my weights and checking Bastoni.
So based on the rankings you see above, as well as 78% | Jules Kounde (DR), I would expect Bastoni to come ~4.8 position on average, but we'll see.
82% | Kim Min Jae (DC) - 3rd, 3rd, 6th, 6th, 3rd, 4th, 5th = 4.286 position 77% | Alessandro Bastoni (DC) [Exellent version] - 3rd, 5th, 5th, 3rd, 3rd, 7th = 4.333 position 75% | Kurt Zouma (DC) - 7th, 5th, 6th, 3rd = 5.6 position 73% | Shota Fukuoka (DC) [Exellent version] - 7th, 8th, 7th, 8th, 8th, 11th = 8.166 position 71% | Sean Goldberg (DC) - 5th, 16th (sacked), 8th (sacked), 5th = 8.5 position
I withdraw saying that Fukuoka is better than Bastoni. My mistake was to assume that the GS rating reflected the FMST26 rating.
But we see here that the rating for both players in FMST26 aligns correctly.
I got ahead of myself because I know that Maeda & Furuhashi are slightly better than Lautaro Martinez, even though Martinez has better attributes in literally almost every way - except dirtiness and injury proneness, and the case looked at a glance to be the same here.
So there is a translation to GS problem here.
Now if I compare DC % between FMST26 and GS, the following players have significant discrepancies (2% or more, when both are adjusted to 77.9% max):
Declan Rice - 77.1% (FMST26) vs. 74.76% (GS) = -2.34% Fiyako Tomori - 71.9% (FMST26) vs. 74.33% (GS) = +2.43% Nacho - 70.9% (FMST26) vs. 73.51% (GS) = +2.61% Levi Colwill - 71.1% (FMST26) vs. 73.27% (GS) = +2.17% Shota Fukuoka [Exellent version] - 69.3% (FMST26) vs. 73.32% (GS) = +4.02% Pantelis Hatzidiakos - 69.1% (FMST26) vs. 72.10% (GS) = +3.00% Cristian Romero - 69.1% (FMST26) vs. 71.96% (GS) = +2.86% Pascal Struijk - 68.8% (FMST26) vs. 71.88% (GS) = +3.08% Federico Dimarco - 74.0% (FMST26) vs. 71.72% (GS) = -2.28% Maxence Lacroix - 68.7% (FMST26) vs. 71.69% (GS) = 2.99%
That's 10 out of the top 70 players (14.3%), and he happened to find the worst one of the bunch, so overall I'm not too concerned. Bastoni has a 1.6% underrating in GS.
Maeda, who benefits from the high negative dirtiness and injury proneness values (he has '2' and '3' respectively) already had to be compromised down from 4th in FMST26 to 16th in GS, so it's a bit of a damned if you do, damned if you don't situation with GS. This is just the limit of GS. No doubt it could be improved a bit, but it's not going to be able to match FMST26.
A more appropriate example to compare to Bastoni is Illia Zabarnyi, whom Exellent castigated, as Zabarnyi also has very low dirtiness (2) & injury proneness (3), but has an equal rating to Bastoni in FMST26 (both ~78%)
78% | Illia Zabarnyi (DC) - 3rd, 5th, 4th, 5th, 2nd = 3.8 position 82% | Kim Min Jae (DC) - 3rd, 3rd, 6th, 6th, 3rd, 4th, 5th = 4.286 position 77% | Alessandro Bastoni (DC) [Exellent version] - 3rd, 5th, 5th, 3rd, 3rd, 7th = 4.333 position 75% | Kurt Zouma (DC) - 7th, 5th, 6th, 3rd = 5.6 position 73% | Shota Fukuoka (DC) [Exellent version] - 7th, 8th, 7th, 8th, 8th, 11th = 8.166 position 71% | Sean Goldberg (DC) - 5th, 16th (sacked), 8th (sacked), 5th = 8.5 position
Note: I capped Zabarnyi's PA to just above CA so that he wouldn't grow during the season.
You can see here why I automatically assumed Fukuoka was better than Bastoni, on the basis of his very low dirtiness and injury proneness.
I didn't set dirtiness at such a high negative weighting for the heck of it.
I know it's unintuitive but I'm just reflecting what the data shows. And actually this is the most clear cut example I've seen, for with Maeda you have stuff like work rate and anticipation clouding it a bit. But here, Zabaryni literally has no other advantage than +3 composure, and many disadvantages (including in meaningful attributes!).
I challenge anyone to try and explain why Zabarnyi finishes higher than Bastoni looking at the comparison above, without concluding dirtiness and injury proneness has a massive impact.
Now I have had the thought that it could be that low dirtiness is the necessary cherry on top at the highest level, but diminishes in relative importance at lower levels. I lean towards no, but we'll cross this bridge when we come to it - I figure that the most common, or final goal, is to win at a high level in the game, and so that is what I have remained focused on for now.
Rain said: We could really solve this "which file is best?" problem pretty easily. Take whichever files say your original, pure performance, prem 2.1, keith, etc. and just use each file to make a team in the league based on the best player you can buy for 1 mil and under (Should filter out teams using a bunch of the same top players) and if they do have the same player just clone them. Then just run the league a good amount of times and take the median results. Expand
Currently running sims it will probably take a while to get a good sample size. Took me forever just setting it up for 5 teams. There's definitely dupes (Especially pure performance team), but should be different enough. Had to avoid the big 3 FA GKs in the original db as they would have been in every team (De Gea, Leno, Neto) Although ended up with a few Ochoa anyway.
Rain said: Currently running sims it will probably take a while to get a good sample size. Took me forever just setting it up for 5 teams. There's definitely dupes (Especially pure performance team), but should be different enough. Had to avoid the big 3 FA GKs in the original db as they would have been in every team (De Gea, Leno, Neto) Although ended up with a few Ochoa anyway. Expand So what files are you comparing, and are you using FM24 or FM26?
Make sure you're using full detail, can be overlooked
I couldn't include every attribute, there's some limit occurring in FMSS, but it'll only be a few minor ones missing. I had to take off professionalism from outfield though. You could swap 'Balance: 3.03' for 'Professionalism: 3.19' if you like.
I've simplified dirtiness & injury proneness. I also can't verify the accuracy at all because it's FM26 only.
GeorgeFloydOverdosed said: I withdraw saying that Fukuoka is better than Bastoni. My mistake was to assume that the GS rating reflected the FMST26 rating. Expand Your ranking for the tools is the following, correct? 1. FMST26 2. FMSS 3. FM Genie Scout
Make sure you're using full detail, can be overlooked Expand
FM 24 and yes I'm using full detail. I went with Orion's classic, Harvestgreen's test weights, Keiths he posted, your Pure Performance, and Premier League 2.1
Rain said: FM 24 and yes I'm using full detail. I went with Orion's classic, Harvestgreen's test weights, Keiths he posted, your Pure Performance, and Premier League 2.1 Expand
I couldn't include every attribute, there's some limit occurring in FMSS, but it'll only be a few minor ones missing. I had to take off professionalism from outfield though. You could swap 'Balance: 3.03' for 'Professionalism: 3.19' if you like.
I've simplified dirtiness & injury proneness. I also can't verify the accuracy at all because it's FM26 only. Expand
FM24 Ratings File Tests - Max Players Loaded and full detail for matches - Removed all players from teams and added starters and backups at every position according to best rating for the position at £1 million sale value or lower (Did not use De Gea, Leno or Neto as they were by far the top GKs and Free agents) - Clones were made via FMRTE of players that were used on more than one team (Disregard pictures of players as I used academy players to import the stats on) - All teams used the top 4-2-3-1 tactic Highway Star and Blues Routines on set pieces - All players were frozen given homegrown status, work permits, healed, and changed all morale to good
After doing all this honestly we all know which attributes are the most important and there really isn't that big of a difference anywhere. To be fair the best three are the most recent ones. Harvestgreen's file was made by translating the percentages to weights. If anyone is interested in doing more I can upload the save file, but it seems very up and down with Pure Performance really being the most consistent hovering around 6th-10th besides one finish in 15th. Also makes sense seeing Pure Performance had the most dupes from other teams. All the data is in the google sheet below as well as the screenshots. Attached are the starting teams.
Summary Pure Performance: 8.90 Position, 56.80 Points, 5.20 GD Keith File: 10.40 Position, 52.30 Points, 2.10 GD Premier League 2.1: 10.70 Position, 51.70 Points, 3.10 GD Orion Classic Match Engine File: 11.40 Position, 47.70 Points, -8.30 GD Harvestgreen Weights: 11.90 Position, 49.20 Points, -8.20 GD
Rain said: If anyone is interested in doing more I can upload the save file Expand If you don't mind, I would like that save file, to have a closer look at it.
I was anxious about this test because I haven't done it myself since comparing Pure Performance & Premier League 1.0 with Orion's weights, and I thought it's 50/50 how it goes.
Now that it's done I'll make my comments and critiques, and thankfully at least my Pure Performance file topped out by a decent margin, so hopefully less chance I'll be seen as just being a sour puss.
I guess I'll start by saying now it can be seen that I wasn't just making up the numbers in my own comparison test, where the results were Pure Performance 6.5, Premier League 1.0 7.333, and Orion's weights 13.166. You can see the results are similar, particularly if you look at the individual samples (I didn't do as many samples).
Now, my critiques:
I'll start with an intuitive example. In keithb's file Maeda is rank 102 for FS, and in Premier League 2.1 he is rank 17. Regardless of which file you assume is better, if you were assessing based on this player alone there would be obviously be a great difference. The thing is, these exceptions to the rule constitute a minority of players, and so if you're picking a full squad, half are going to be identical players, and many of the rest are going to be minor differences like Mbappe vs. Haaland. In fact, it's a surprise there's any significant difference at all between HarvestGreen's/Orion's weights and Pure Performance for this reason.
Now if you're on board with that, then let's take it to the next matter. Because now I'm going to show that those exceptions matter, and I would argue you can't really just conclude 'well, if they're all about the same once you buy a full squad, who cares'.
Suppose I want a top striker for my team. I load up keithb's ratings, sort by FS, and find that the cheapest of the top 20 is Victor Gyokeres for a GS estimated sale value of £100mil. If I use Premier League 1.0, in the top 20 I have Furuhashi (£33.8mil), Maeda (£22.4mil), Jhon Cordoba (£8.5mil) and even a few more under the cheapest in keithb's ratings. If I load up FM24 now as Fulham and make an offer for Gyokeres, they want £41.5mil, whereas for Maeda it's £12.5mil, so it's not just GS. Pure Performance also has this problem, although to a lesser extent than keithb's file - the cheapest in the top 20 FS is Umar Sadiq for £40mil sale value (~£20mil in game).
Now who would argue money is no matter in FM?
So one thing I'm interested in seeing in your save, is the relative cost/value of each squad. I don't actually know if Premier League 2.1 would be significantly less expensive to purchase, but I suspect it would be.
Now the matter of performance. I have high confidence that Premier League 2.1 is going to give more accurate performance estimations than Pure Performance. I am confident because I have tested a player like Maeda, and I know with certainty he gets the team to 3rd, so he's definitely up there with the best. So how then does it finish worse here? Because these files should be comparing by performance alone, not cost - the low cost would just be a symptom of the improved efficiency.
I can think of a few possibilities here, but I'll just say the main two.
You 'froze' and 'healed' the players. Two of the biggest factors in Premier League 2.1 are dirtiness and injury proneness. If you prevent red cards, injuries, and so on, then you'd be disrupting a key part of the natural process. But I'm not sure exactly what the freeze/healing extends to.
The second thing is that while the goal of Premier League 2.1 is to assess performance rather than value, this does nonetheless loop back around.. let me demonstrate what I mean by this:
Your selections for ST are as follows:
Premier League 2.1 - Adam Zrelak, 113 CA, £2k/week, Warta Poznań (Poland Div 1) Keithb - Alexis Sanchez, 137 CA, £78k/wk, Inter Milan Pure Performance - Jair Silva, 112 CA, £1.2k/week, Leiria (Portugal Div 2) Orion - Choupo-Moting, 137 CA, £123k/wk, FC Bayern HarvestGreen - Dickson Abiama, 110 CA, £10k/wk, FC Kaiserslautern
If I've thought about this right, what is going on here is a problem with the methodology where because the better players are actually getting pushed up in Premier League 2.1 (i.e. Maeda 102 -> 16) this leaves what's left down at player 102 slightly weaker and yet still adequate, while also being more populated by even lower CA players who have been pushed up (i.e. Zrelak 300 > 100 say).
To complicate matters, this would only affect a minority of players, because people like Maeda and Zrelak are the exceptions not the rule, and for that majority remainder most of them are going to be the same selections (overlap) while one or two (differences) may even be better than Premier League 2.1. So for example if you selected players at rank 102, guess what, keithb gets Maeda and Premier League 2.1 gets someone like Zrelak. But actually Alexis Sanchez is higher rated in keithb's file than in Premier League 2.1. So it's overall its like I got Maeda/Kuruhashi/Cordoba right and Sanchez wrong, while keithb gets Maeda/Kuruhashi/Cordoba wrong, but gets Sanchez right. But you tell me what you think of this theory.
To put it another way, the file that would finish 1st in your test would have Haaland, Mbappe, etc. at the rank of 300 or whatever it is that you are selecting at. However it does nonetheless have use, because it tells us how many duds are pulling the team down. For example, keithb's team has an ST from Inter Milan, yet why does it still get beaten by Pure Performance on average? I reckon if we have a look at the file, Sanchez will get 7.3+ rating, but a few duds will get 6.5. Just my guess.
Suppose we have that situation where a file makes Haaland rank 300. How do we actually tell Haaland from Joe Blow from Slough, in that case? How can we say that file is 'wrong', when it actually 'performs' better?
The answer is we look at his value. This is why value matters, even for assessing pure performance. Because once we see Haaland's £300mil asking price, compare it to our £18,582 transfer budget, we quickly move on to the player below him - who is Joe Blow from Slough.
Keep in mind it's not at all saying that higher value = strictly better performance. What I'm instead saying is that if a player has a significantly higher value, it's highly unlikely that he is going to be worse. It's like if I buy a $200 toaster. Is it going to be worse than the old cheap one? Probably not. Is it going to toast better? Not necessarily.
The fundamental basis for this is CA vs attribute imbalance. Very old players have the worst imbalances (i.e. Dybala - ~9 physical, ~18 mental/technical) and often high rep, and therefore generally the worst over-valuations. Dybala is valued at £10mil. Now there are a few players who are significantly better for the same price or less, such as Maeda, but it's a minority. Now try the inverse, find me a player who is low value but very highly rated. Again, it's a minority.
Now you might say, well if value is such a reliable correlation, why not rely on that alone? The answer is that those players with £300mil valuations, even though they make up the majority of the top players, are useless to us. We are looking for the diamonds in the rough, even if we 'just want the best performing players right now', because you need to pay to get them! Hence valuations are an important/useful measurement for telling Haaland from Joe Blow, but NOT for ranking utility, and even if you did have the billions to spend, valuation does an inadequate job of distinguishing exceptions to the rule. It is an assessment and therefore indicator of quality itself rather than a contributor to quality, and so it can be used to critique a ranking but not determine it. In fact we want our ranking system to find as many exceptions to the valuation ranking as possible, so long as they are valid.
Your translation isn’t wrong at all — I think we’re just optimizing for two slightly different things.
Your method normalizes the coefficients so the strongest attribute weight becomes 20, which makes a lot of sense if the goal is to express the weights themselves on an FM-style 1–20 scale.
For mine, I used GPT-5.6’s reasoning to preserve the full FMST formula as literally as possible and translate the final FMST score onto FMSS’s 1–20 scale.
The main difference is that I use the same ÷5 conversion for both outfield and GK, because that gives:
FMSS Meta = FMST score ÷ 5
So 100 → 20, 90 → 18, 75 → 15, etc.
That also means GK and outfield remain on exactly the same scale. With the “highest coefficient = 20” approach, outfield ends up using roughly ÷4.7 while GK uses roughly ÷4.4445, so the two formulas are normalized slightly differently.
I also kept every FMST term that FMSS can access, including hidden/personality attributes, the CA penalty for GKs, and the original nonlinear Injury Proneness and Dirtiness calculations rather than simplifying them into fixed weights.
So I definitely wouldn’t call your version wrong — it’s a good normalized/simplified implementation. I just think the GPT-5.6 version is more faithful if the objective is specifically to port the complete FMST calculation into FMSS while keeping the output on a consistent 1–20 scale.
If you want, I can send/upload the exact code I’m using so you can compare the implementations directly.
Your translation isn’t wrong at all — I think we’re just optimizing for two slightly different things.
Your method normalizes the coefficients so the strongest attribute weight becomes 20, which makes a lot of sense if the goal is to express the weights themselves on an FM-style 1–20 scale.
For mine, I used GPT-5.6’s reasoning to preserve the full FMST formula as literally as possible and translate the final FMST score onto FMSS’s 1–20 scale.
The main difference is that I use the same ÷5 conversion for both outfield and GK, because that gives:
FMSS Meta = FMST score ÷ 5
So 100 → 20, 90 → 18, 75 → 15, etc.
That also means GK and outfield remain on exactly the same scale. With the “highest coefficient = 20” approach, outfield ends up using roughly ÷4.7 while GK uses roughly ÷4.4445, so the two formulas are normalized slightly differently.
I also kept every FMST term that FMSS can access, including hidden/personality attributes, the CA penalty for GKs, and the original nonlinear Injury Proneness and Dirtiness calculations rather than simplifying them into fixed weights.
So I definitely wouldn’t call your version wrong — it’s a good normalized/simplified implementation. I just think the GPT-5.6 version is more faithful if the objective is specifically to port the complete FMST calculation into FMSS while keeping the output on a consistent 1–20 scale.
If you want, I can send/upload the exact code I’m using so you can compare the implementations directly. Expand With your formula, the problem is that it uses too many attributes. For some reason, FMSS will fail with all of them included. At least it did for me.
So one thing I'm interested in seeing in your save, is the relative cost/value of each squad. I don't actually know if Premier League 2.1 would be significantly less expensive to purchase, but I suspect it would be. Expand
I mentioned this before, but forgot to add it to the post. Everyone was £1 million sale value or lower on Genie Scout. I tried to use FMST specifically for your 2.1 file but was tough to do considering you can't filter by sale value and that program just constantly freezes for me. I'm sure this test has a lot of rng, but it was more so for myself to see if there's even a big difference at this point. Made me feel better about using the blended and pure performance the most when buying players I guess. I didn't really take a close look at stats, but when I did look it seemed Zrelak was doing really well. I uploaded the save file to that google drive folder.
Rain said: I mentioned this before, but forgot to add it to the post. Everyone was £1 million sale value or lower on Genie Scout. I tried to use FMST specifically for your 2.1 file but was tough to do considering you can't filter by sale value and that program just constantly freezes for me. I'm sure this test has a lot of rng, but it was more so for myself to see if there's even a big difference at this point. Made me feel better about using the blended and pure performance the most when buying players I guess. I didn't really take a close look at stats, but when I did look it seemed Zrelak was doing really well. I uploaded the save file to that google drive folder. Expand I was wrong about the transfer value theory. I realized this as I was creating my own my test afterwards, saw the overlap in players I myself was selecting, and remembered the 1mil limit you mentioned. My mind saw the high wages and went straight to transfer value.
I thought that nonetheless, wage is kind of a similar measurement.. particularly for older players, who have low value to advantaged age and short contracts.
But after conducting my own test, I am getting about the same results, even with my refinements that I feel do it better. My refinements are that I select just one player for each position but duplicate 3-4 times, I get my choices first by exporting shortlist from FM24 for Luton where interest is at least 'doubtful', then I choose one of the top 4 or 5 who has the lowest value, and I play it out as a normal game (meta training, friendlies, etc.) and I'm testing one team at a time (replaced the roster at Luton).
My results so far are:
Premier League 2.1 - 10th, 9th, 11th = 10 position Keithb - 11th, 11th, 16th, 13th = 12.75 position
keithb:
GK - Edgar Badia 79.1% DL - Hamza Mendyl 69.9% DC - Kim Min Tae 72.4% DR - Jusuf Gazibegovic 72.1% DM - Gaius Makouta 73.5% AML - Michael (Al-Hilal) 70.3% AMR - Jacob Murphy 74.8% ST - Jhon Cordoba 77.4%
Premier League 2.1:
GK - Edgar Badia 79.1% DL - Jesus Gallardo 72.6% DC - Kim Min Tae 72.4% DR - Wajdi Kechrida 74.1% DM - Aliou Dieng 74.8% AML - Zakaria Aboukhlal 73.2% AMR - Jacob Murphy 74.8% ST - Jhon Cordoba 77.4%
% is my FMST26 rating. So there's a ~2% difference on 5/11 of the team.
I'm currently testing a new idea that occurred to me after this, which is what if I take keithb's top players that my rating says are rubbish - so the biggest discrepancies - and then test a team of those. So we'll see what that difference is.
Of course, ordinarily one would not happen to pick all the bad eggs in keithb's file; the difference in normal use remains ~2.75 positions according to my test, or a marginal difference according to yours.
Before when you were doing your test, I also manually had a go at wiping Luton and buying the best players I could with a £10mil budget. So basically actually playing the game to see the best I could actually sign as the lowest and impoverished Premier League team. Honestly I expected I would get 1st, but actually I only achieved 8th.
I hadn't thought about just duplicating the starters that's a good idea. I just wouldn't want them to end up playing alongside eachother in the starting 11. If I was smarter I would have came up with a way to automate the whole process, but I figured in the end it probably didn't make much difference to what I already knew.
I think what I've learned recently is when buying young players I might just start using all the weights except Pace/Accel and just set a minimum there knowing I can train that up pretty easily before they actually end up playing for me.
GeorgeFloydOverdosed said: With your formula, the problem is that it uses too many attributes. For some reason, FMSS will fail with all of them included. At least it did for me.
Normalizing them however you like is fine though Expand
That makes sense if you actually ran into a limitation in your build.
From the app.js I’m using though, GPT-5.6 checked the scoring path and there doesn’t seem to be a hard attribute-count limit there — it just loops through the weights that are defined and skips values that aren’t available. So the issue you ran into might be somewhere else in the FMSS pipeline/version rather than the Meta calculation itself.
Looking at our two versions side by side, I also think the main difference isn’t really 4.7 vs 5. For the attributes we both include, the relative weighting is basically the same — yours is normalized so Pace = 20, while mine uses ÷5 so the final FMST score translates consistently onto FMSS’s 1–20 scale.
The bigger difference is completeness. Mine keeps more of the original FMST formula wherever FMSS exposes the data: Consistency, Important Matches, Professionalism, Natural Fitness, Aggression, etc. It also keeps the original Injury Proneness and Dirtiness interactions rather than simplifying them into fixed weights.
So I’d describe yours as a more compact/simplified FMST implementation, while mine is trying to be a more literal port of the full formula.
If the full version really does cause problems in certain FMSS builds, then your reduced version obviously makes sense for robustness. Mine is currently running fine with the full set though, so if you want I can send you my app.js and maybe you can spot what caused the limitation on your side.
bf3metro said: That makes sense if you actually ran into a limitation in your build.
From the app.js I’m using though, GPT-5.6 checked the scoring path and there doesn’t seem to be a hard attribute-count limit there — it just loops through the weights that are defined and skips values that aren’t available. So the issue you ran into might be somewhere else in the FMSS pipeline/version rather than the Meta calculation itself.
Looking at our two versions side by side, I also think the main difference isn’t really 4.7 vs 5. For the attributes we both include, the relative weighting is basically the same — yours is normalized so Pace = 20, while mine uses ÷5 so the final FMST score translates consistently onto FMSS’s 1–20 scale.
The bigger difference is completeness. Mine keeps more of the original FMST formula wherever FMSS exposes the data: Consistency, Important Matches, Professionalism, Natural Fitness, Aggression, etc. It also keeps the original Injury Proneness and Dirtiness interactions rather than simplifying them into fixed weights.
So I’d describe yours as a more compact/simplified FMST implementation, while mine is trying to be a more literal port of the full formula.
If the full version really does cause problems in certain FMSS builds, then your reduced version obviously makes sense for robustness. Mine is currently running fine with the full set though, so if you want I can send you my app.js and maybe you can spot what caused the limitation on your side. Expand
edit: I tested it properly on my current build. I ran the full weightedMeta() directly, uncached, across 94,111 players using all 23 outfield weights and 21 GK weights. It completed in ~74 ms with 0 errors and 0 invalid scores. I also checked for missing attributes and got none, and PA-Meta passed all 94,111 players too. So whatever attribute-count limitation you ran into doesn’t seem to reproduce on my current FMSS version. Maybe it was related to an older build/plugin or a different part of the data pipeline.
edit: I tested it properly on my current build. I ran the full weightedMeta() directly, uncached, across 94,111 players using all 23 outfield weights and 21 GK weights. It completed in ~74 ms with 0 errors and 0 invalid scores. I also checked for missing attributes and got none, and PA-Meta passed all 94,111 players too. So whatever attribute-count limitation you ran into doesn’t seem to reproduce on my current FMSS version. Maybe it was related to an older build/plugin or a different part of the data pipeline. Expand
I cannot copy paste this format in FMST, can you help me with that?
bf3metro said: So whatever attribute-count limitation you ran into doesn’t seem to reproduce on my current FMSS version. Maybe it was related to an older build/plugin or a different part of the data pipeline. Expand I figured it could be this. I'm using the latest version I believe. I'll try doing a reinstall later on.
You've got it working, and anyone who uses FMSS can use your weights.
Trying to debug code frustrates the hell out of me. I don't know how people willingly do it every day for a living. I've also found it tedious translating the FMST26 weights to GS.
I'm not quite satisfied with the GS weights, especially in light of Rain's recent test, and the 15% discrepancy rate between the FMST26 and GS weights. I want my weights to perform at least slightly better in every respect than anything else ideally. I give 8/10 now though.
I guess Rain's finding that there isn't too much difference overall between different weightings makes sense when you do the math on it.
5/11 players @ +2% = +10% for +2.75 position = +0.55 position per player @ +2% Maeda (83%) 3.0 vs. Dybala (69%) 6.4 = +14% for +3.4 position
+10% for +2.75 position = +3.63% for +1 position +14% for +3.4 position = +4.11% for +1 position
Could be just a coincidental correlation, but I reckon it's probably reflecting a consistent effect. The 80%/78%/76%/74% team test does suggest that the % differences can be simplified to addition, as there were strong distinctions in the results.
I'm putting my comparison test of keithb's biggest discrepancies with Premier League 2.1 on hold for now, but if we just take Maeda vs. Heung-Min Son for a quick picture, there's a ~8.9% discrepancy. Let's say in a worst case scenario you sign 4 of your starting 11 as these discrepancies:
8.9% x 4 = 35.6% If ~4% ≈ 1 position, then 35.6% = 8.9 position
So the most difference you could get from keithb or GS default weights say and mine, or whatever is best, is probably 9th vs 18th.
If we suppose the chance of a Maeda-like discrepancy (+ the curve leading up to Maeda) is ~8% total, then:
1/11 discrepancy ≈ 39.4% chance of -2.22 position 2/11 discrepancy ≈ 17.3% chance of -4.45 position 3/11 discrepancy ≈ 4.6% chance of -6.67 position 4/11 discrepancy ≈ 0.82% chance of -8.9 position
That is to be added on top of the common ~2% difference in ratings.
So let's say its a realistic worst case scenario where its 2x Maeda + 3x identical + 6x the typical ~2% difference:
~15% chance, with result of -7.45 position (i.e. 9 vs 16.45 position)
GeorgeFloydOverdosed said: I figured it could be this. I'm using the latest version I believe. I'll try doing a reinstall later on.
You've got it working, and anyone who uses FMSS can use your weights.
Trying to debug code frustrates the hell out of me. I don't know how people willingly do it every day for a living. I've also found it tedious translating the FMST26 weights to GS.
I'm not quite satisfied with the GS weights, especially in light of Rain's recent test, and the 15% discrepancy rate between the FMST26 and GS weights. I want my weights to perform at least slightly better in every respect than anything else ideally. I give 8/10 now though.
I guess Rain's finding that there isn't too much difference overall between different weightings makes sense when you do the math on it.
5/11 players @ +2% = +10% for +2.75 position = +0.55 position per player @ +2% Maeda (83%) 3.0 vs. Dybala (69%) 6.4 = +14% for +3.4 position
+10% for +2.75 position = +3.63% for +1 position +14% for +3.4 position = +4.11% for +1 position
Could be just a coincidental correlation, but I reckon it's probably reflecting a consistent effect. The 80%/78%/76%/74% team test does suggest that the % differences can be simplified to addition, as there were strong distinctions in the results.
I'm putting my comparison test of keithb's biggest discrepancies with Premier League 2.1 on hold for now, but if we just take Maeda vs. Heung-Min Son for a quick picture, there's a ~8.9% discrepancy. Let's say in a worst case scenario you sign 4 of your starting 11 as these discrepancies:
8.9% x 4 = 35.6% If ~4% ≈ 1 position, then 35.6% = 8.9 position
So the most difference you could get from keithb or GS default weights say and mine, or whatever is best, is probably 9th vs 18th.
If we suppose the chance of a Maeda-like discrepancy (+ the curve leading up to Maeda) is ~8% total, then:
1/11 discrepancy ≈ 39.4% chance of -2.22 position 2/11 discrepancy ≈ 17.3% chance of -4.45 position 3/11 discrepancy ≈ 4.6% chance of -6.67 position 4/11 discrepancy ≈ 0.82% chance of -8.9 position
That is to be added on top of the common ~2% difference in ratings.
So let's say its a realistic worst case scenario where its 2x Maeda + 3x identical + 6x the typical ~2% difference:
~15% chance, with result of -7.45 position (i.e. 9 vs 16.45 position) Expand
I really like the work you’ve done with all of this. You’re basically the pivotal part of it — I’ve only translated/adapted what you already built into FMST. The testing, comparisons and all the work you’ve put into the weights are the reason there’s something solid to translate in the first place.
I’m really looking forward to whatever updates you make next, especially if you keep refining the GS weights after Rain’s latest testing. And I genuinely hope you’ll still be around doing this for FM27 as well — it would feel weird going into a new FM without your testing and weight work to build from 😅
On the differences between weighting systems, what you’re saying makes sense to me. The average difference might be relatively small, but I think the important cases are the outliers where one system values a player very differently from another.
If Maeda-type discrepancies are relatively rare, most squads probably won’t be massively affected, but getting even 2–3 of those decisions wrong in the same XI could still create a pretty meaningful performance difference.
The ~4% ≈ 1 league position relationship looks surprisingly consistent from the examples you’ve got. I’d probably still treat it as an empirical approximation rather than something perfectly linear, but there definitely seems to be something there.
And yeah, the FMSS translation seems completely fine on my side now. I stress-tested the full weights across my database and it runs with no missing attributes or calculation errors, so if you or anyone else wants to use/share the FMSS weights, absolutely feel free.
I've re-examined training according to what matters in the Premier League 2.1 weights, for both outfield and GK.
This time I was able to calculate everything quickly and comprehensively utilizing ChatGPT with HarvestGreen's excel sheets.
I haven't calculated every schedule exhaustively, just the ones you see here, most of which were the most promising previously.
Overall I recommend either 260 [Physical][Match Practice][Attacking]x2[Quickness Focus] for squad with high CA-PA gap or 156 [Physical][Quickness][Transition Restrict][Quickness Focus] with low CA-PA gap. Or 214 [Physical]x2[Attacking]x2[Quickness Focus] for something inbetween.
Green = The new best training schedules, in my opinion Light blue = The two schedules I have last recommended. They're both still worth considering. Deep blue = ZaZ's recommended schedule Pink = A long time popular meta Purple = HarvestGreen's last recommendation
Where no focus is listed, it's Quickness Focus.
Workload will be a little inaccurate, as I eyeballed the intensity bars rather than calculated it.
GeorgeFloydOverdosed said: I've re-examined training according to what matters in the Premier League 2.1 weights, for both outfield and GK.
This time I was able to calculate everything quickly and comprehensively utilizing ChatGPT with HarvestGreen's excel sheets.
I haven't calculated every schedule exhaustively, just the ones you see here, most of which were the most promising previously.
Overall I recommend either 260 [Physical][Match Practice][Attacking]x2[Quickness Focus] for squad with high CA-PA gap or 156 [Physical][Quickness][Transition Restrict][Quickness Focus] with low CA-PA gap. Or 214 [Physical]x2[Attacking]x2[Quickness Focus] for something inbetween.
Green = The new best training schedules, in my opinion Light blue = The two schedules I have last recommended. They're both still worth considering. Deep blue = ZaZ's recommended schedule Pink = A long time popular meta Purple = HarvestGreen's last recommendation
Where no focus is listed, it's Quickness Focus.
Workload will be a little inaccurate, as I eyeballed the intensity bars rather than calculated it. Expand
Hey, based on all the testing you’ve done here, do you have what you’d consider an optimal schedule to actually use week-to-week over a full season?
I’ve been using ZaZ’s Growth 2, but in my save it really isn’t delivering the development I expected.
What I’m mainly looking for is a schedule that pushes CA growth as fast as possible so players reach their PA quickly, rather than just maximizing CA efficiency.
Would you recommend switching fully to something like 260 / 214 / 156 depending on the players’ CA–PA gap, or do you have a specific weekly/monthly rotation you think is optimal in practice?
I personally like the training schedules with recovery the most, I try to keep my backup players sharpness as high as possible and recovery seems to preserve sharpness better than rest. Also I notice that for some reason the Attacking session yields an unusual number of injuries, more so than Defending or Overall. I could be wrong, but it's something I've noticed in my saves.
Exellent said: Hey, I tested your latest rating build, and it’s a complete disaster.

 Spoiler


your super rating says that Shota Fukuoka is better than Bastoni.
I've inputted the stats shown for Fukuoka into FM24. I ended up with 131 instead of 135 CA, probably because of some lacking DL/DR/weak foot proficiency, but that's no issue. The only other difference is that I've changed Fukuoka's nation to England, so that his low adaptability doesn't mess with things.
Here is the result:
82% | Kim Min Jae (DC) - 3rd, 3rd, 6th, 6th, 3rd, 4th, 5th = 4.286 position
75% | Kurt Zouma (DC) - 7th, 5th, 6th, 3rd = 5.6 position
73% | Shota Fukuoka (DC) [Exellent version] = 7th, 8th, 7th, 8th, 8th, 11th = 8.166 position
71% | Sean Goldberg (DC) - 5th, 16th (sacked), 8th (sacked), 5th = 8.5 position
I'm using the FMST26 % as that is more accurate and what I always refer to, but you can see the difference is only 73% vs 75% anyway.
Kurt Zouma is quite similar to Bastoni if you compare the stats:
But I will also do a clone of Bastoni for comparison so that there's no doubt about it.
This is all a good test of my claims, because this way no one can say it's only valid for cherrypicked players.
While I'm doing Bastoni I do notice that he is actually 77.9% in FMST26, for FM24 (where he has largely the same stats). Anyone can verify this by loading up FMST26 with my weights and checking Bastoni.
So based on the rankings you see above, as well as 78% | Jules Kounde (DR), I would expect Bastoni to come ~4.8 position on average, but we'll see.
82% | Kim Min Jae (DC) - 3rd, 3rd, 6th, 6th, 3rd, 4th, 5th = 4.286 position
77% | Alessandro Bastoni (DC) [Exellent version] - 3rd, 5th, 5th, 3rd, 3rd, 7th = 4.333 position
75% | Kurt Zouma (DC) - 7th, 5th, 6th, 3rd = 5.6 position
73% | Shota Fukuoka (DC) [Exellent version] - 7th, 8th, 7th, 8th, 8th, 11th = 8.166 position
71% | Sean Goldberg (DC) - 5th, 16th (sacked), 8th (sacked), 5th = 8.5 position
I withdraw saying that Fukuoka is better than Bastoni. My mistake was to assume that the GS rating reflected the FMST26 rating.
But we see here that the rating for both players in FMST26 aligns correctly.
I got ahead of myself because I know that Maeda & Furuhashi are slightly better than Lautaro Martinez, even though Martinez has better attributes in literally almost every way - except dirtiness and injury proneness, and the case looked at a glance to be the same here.
So there is a translation to GS problem here.
Now if I compare DC % between FMST26 and GS, the following players have significant discrepancies (2% or more, when both are adjusted to 77.9% max):
Declan Rice - 77.1% (FMST26) vs. 74.76% (GS) = -2.34%
Fiyako Tomori - 71.9% (FMST26) vs. 74.33% (GS) = +2.43%
Nacho - 70.9% (FMST26) vs. 73.51% (GS) = +2.61%
Levi Colwill - 71.1% (FMST26) vs. 73.27% (GS) = +2.17%
Shota Fukuoka [Exellent version] - 69.3% (FMST26) vs. 73.32% (GS) = +4.02%
Pantelis Hatzidiakos - 69.1% (FMST26) vs. 72.10% (GS) = +3.00%
Cristian Romero - 69.1% (FMST26) vs. 71.96% (GS) = +2.86%
Pascal Struijk - 68.8% (FMST26) vs. 71.88% (GS) = +3.08%
Federico Dimarco - 74.0% (FMST26) vs. 71.72% (GS) = -2.28%
Maxence Lacroix - 68.7% (FMST26) vs. 71.69% (GS) = 2.99%
That's 10 out of the top 70 players (14.3%), and he happened to find the worst one of the bunch, so overall I'm not too concerned. Bastoni has a 1.6% underrating in GS.
Maeda, who benefits from the high negative dirtiness and injury proneness values (he has '2' and '3' respectively) already had to be compromised down from 4th in FMST26 to 16th in GS, so it's a bit of a damned if you do, damned if you don't situation with GS. This is just the limit of GS. No doubt it could be improved a bit, but it's not going to be able to match FMST26.
A more appropriate example to compare to Bastoni is Illia Zabarnyi, whom Exellent castigated, as Zabarnyi also has very low dirtiness (2) & injury proneness (3), but has an equal rating to Bastoni in FMST26 (both ~78%)


78% | Illia Zabarnyi (DC) - 3rd, 5th, 4th, 5th, 2nd = 3.8 position
82% | Kim Min Jae (DC) - 3rd, 3rd, 6th, 6th, 3rd, 4th, 5th = 4.286 position
77% | Alessandro Bastoni (DC) [Exellent version] - 3rd, 5th, 5th, 3rd, 3rd, 7th = 4.333 position
75% | Kurt Zouma (DC) - 7th, 5th, 6th, 3rd = 5.6 position
73% | Shota Fukuoka (DC) [Exellent version] - 7th, 8th, 7th, 8th, 8th, 11th = 8.166 position
71% | Sean Goldberg (DC) - 5th, 16th (sacked), 8th (sacked), 5th = 8.5 position
Note: I capped Zabarnyi's PA to just above CA so that he wouldn't grow during the season.
You can see here why I automatically assumed Fukuoka was better than Bastoni, on the basis of his very low dirtiness and injury proneness.
I didn't set dirtiness at such a high negative weighting for the heck of it.
I know it's unintuitive but I'm just reflecting what the data shows. And actually this is the most clear cut example I've seen, for with Maeda you have stuff like work rate and anticipation clouding it a bit. But here, Zabaryni literally has no other advantage than +3 composure, and many disadvantages (including in meaningful attributes!).
I challenge anyone to try and explain why Zabarnyi finishes higher than Bastoni looking at the comparison above, without concluding dirtiness and injury proneness has a massive impact.
Now I have had the thought that it could be that low dirtiness is the necessary cherry on top at the highest level, but diminishes in relative importance at lower levels. I lean towards no, but we'll cross this bridge when we come to it - I figure that the most common, or final goal, is to win at a high level in the game, and so that is what I have remained focused on for now.
GeorgeFloydOverdosed said: Busy in life for a few days right now, but I'll get round to it probably after that
can’t wait for it, mate! good luck in life too!!
Rain said: We could really solve this "which file is best?" problem pretty easily. Take whichever files say your original, pure performance, prem 2.1, keith, etc. and just use each file to make a team in the league based on the best player you can buy for 1 mil and under (Should filter out teams using a bunch of the same top players) and if they do have the same player just clone them. Then just run the league a good amount of times and take the median results.
Currently running sims it will probably take a while to get a good sample size. Took me forever just setting it up for 5 teams. There's definitely dupes (Especially pure performance team), but should be different enough. Had to avoid the big 3 FA GKs in the original db as they would have been in every team (De Gea, Leno, Neto) Although ended up with a few Ochoa anyway.
Rain said: Currently running sims it will probably take a while to get a good sample size. Took me forever just setting it up for 5 teams. There's definitely dupes (Especially pure performance team), but should be different enough. Had to avoid the big 3 FA GKs in the original db as they would have been in every team (De Gea, Leno, Neto) Although ended up with a few Ochoa anyway.
So what files are you comparing, and are you using FM24 or FM26?
Make sure you're using full detail, can be overlooked
bf3metro said: any FMSS update? please, thanks mate!
FMSS Premier League 2.1 weights
Outfield:
const META_W = {
Pace: 20, Acceleration: 19.26, JumpingReach: 9.15, Dribbling: 3.04, Balance: 3.03,
Concentration: 9.57, Anticipation: 8.51, Determination: 9.25, Agility: 3.40, Stamina: 10.64,
Dirtiness: 6.8, Composure: 5.53, WorkRate: 14.15, Pressure: 3.62, InjuryProneness: -4.8,
};
GK:
const META_GK_W = { Determination: 20, Concentration: 18.53, Reflexes: 19.35, AerialReach: 6.45, Agility: 7.35, Pace: 6.37, Acceleration: 3.38, InjuryProneness: -11.03, Dirtiness: -3.68, FirstTouch: 3.83, WorkRate: 8.7, JumpingReach: 3.22, Stamina: 7.35, Technique: 3.53, Flair: 11.03, CommandOfArea: 3.53, Pressure: 3.38, Professionalism: 2.2, NaturalFitness: 2.35, };
I couldn't include every attribute, there's some limit occurring in FMSS, but it'll only be a few minor ones missing. I had to take off professionalism from outfield though. You could swap 'Balance: 3.03' for 'Professionalism: 3.19' if you like.
I've simplified dirtiness & injury proneness. I also can't verify the accuracy at all because it's FM26 only.
GeorgeFloydOverdosed said: I withdraw saying that Fukuoka is better than Bastoni. My mistake was to assume that the GS rating reflected the FMST26 rating.
Your ranking for the tools is the following, correct?
1. FMST26
2. FMSS
3. FM Genie Scout
Kriek said: Your ranking for the tools is the following, correct?
1. FMST26
2. FMSS
3. FM Genie Scout
Yes
GeorgeFloydOverdosed said: So what files are you comparing, and are you using FM24 or FM26?
Make sure you're using full detail, can be overlooked
FM 24 and yes I'm using full detail. I went with Orion's classic, Harvestgreen's test weights, Keiths he posted, your Pure Performance, and Premier League 2.1
Rain said: FM 24 and yes I'm using full detail. I went with Orion's classic, Harvestgreen's test weights, Keiths he posted, your Pure Performance, and Premier League 2.1

I'm curious about your results
GeorgeFloydOverdosed said: FMSS Premier League 2.1 weights
Outfield:
const META_W = {
Pace: 20, Acceleration: 19.26, JumpingReach: 9.15, Dribbling: 3.04, Balance: 3.03,
Concentration: 9.57, Anticipation: 8.51, Determination: 9.25, Agility: 3.40, Stamina: 10.64,
Dirtiness: 6.8, Composure: 5.53, WorkRate: 14.15, Pressure: 3.62, InjuryProneness: -4.8,
};
GK:
const META_GK_W = { Determination: 20, Concentration: 18.53, Reflexes: 19.35, AerialReach: 6.45, Agility: 7.35, Pace: 6.37, Acceleration: 3.38, InjuryProneness: -11.03, Dirtiness: -3.68, FirstTouch: 3.83, WorkRate: 8.7, JumpingReach: 3.22, Stamina: 7.35, Technique: 3.53, Flair: 11.03, CommandOfArea: 3.53, Pressure: 3.38, Professionalism: 2.2, NaturalFitness: 2.35, };
I couldn't include every attribute, there's some limit occurring in FMSS, but it'll only be a few minor ones missing. I had to take off professionalism from outfield though. You could swap 'Balance: 3.03' for 'Professionalism: 3.19' if you like.
I've simplified dirtiness & injury proneness. I also can't verify the accuracy at all because it's FM26 only.
Acceleration: 18.1, Pace: 18.8, JumpingReach: 8.6, Pressure: 3.4, Dribbling: 2.86, WorkRate: 13.3, Agility: 3.2, Anticipation: 8, Composure: 5.2, Stamina: 10, Consistency: 2.81, Determination: 8.7, Balance: 2.85, Strength: 1, Concentration: 9, Finishing: 0.4, ImportantMatches: 2.02, NaturalFitness: 1.29, Professionalism: 3, Ambition: 0.4, Loyalty: 0.2, Aggression: 2, Vision: 0.1,
AerialReach: 5.736, CommandOfArea: 3.138, FirstTouch: 3.398, Passing: 2.092, Reflexes: 17.2, Concentration: 16.47, Determination: 17.778, WorkRate: 7.736, Acceleration: 3.006, Balance: 2.092, Agility: 6.536, JumpingReach: 2.86, NaturalFitness: 2.092, Pace: 5.66, Stamina: 6.536, Strength: 2.092, Technique: 3.138, Pressure: 3.006, Professionalism: 1.96, Flair: 9.804, Vision: 5,
what do you think of that? i think it translates better FMST to FMSS.
FM24 Ratings File Tests
- Max Players Loaded and full detail for matches
- Removed all players from teams and added starters and backups at every position according to best rating for the position at £1 million sale value or lower (Did not use De Gea, Leno or Neto as they were by far the top GKs and Free agents)
- Clones were made via FMRTE of players that were used on more than one team (Disregard pictures of players as I used academy players to import the stats on)
- All teams used the top 4-2-3-1 tactic Highway Star and Blues Routines on set pieces
- All players were frozen given homegrown status, work permits, healed, and changed all morale to good
After doing all this honestly we all know which attributes are the most important and there really isn't that big of a difference anywhere. To be fair the best three are the most recent ones. Harvestgreen's file was made by translating the percentages to weights. If anyone is interested in doing more I can upload the save file, but it seems very up and down with Pure Performance really being the most consistent hovering around 6th-10th besides one finish in 15th. Also makes sense seeing Pure Performance had the most dupes from other teams. All the data is in the google sheet below as well as the screenshots. Attached are the starting teams.
Summary
Pure Performance: 8.90 Position, 56.80 Points, 5.20 GD
Keith File: 10.40 Position, 52.30 Points, 2.10 GD
Premier League 2.1: 10.70 Position, 51.70 Points, 3.10 GD
Orion Classic Match Engine File: 11.40 Position, 47.70 Points, -8.30 GD
Harvestgreen Weights: 11.90 Position, 49.20 Points, -8.20 GD
https://docs.google.com/spreadsheets/d/11cHLvGbtHfZTvLAGujuHHptqfioZ6SliKMqkDe78S6o/edit?usp=sharing
https://drive.google.com/drive/folders/1gS5uI_fK4glwcdYd6bx3VMxX2lXRASAD?usp=sharing
Rain said: If anyone is interested in doing more I can upload the save file
If you don't mind, I would like that save file, to have a closer look at it.
I was anxious about this test because I haven't done it myself since comparing Pure Performance & Premier League 1.0 with Orion's weights, and I thought it's 50/50 how it goes.
Now that it's done I'll make my comments and critiques, and thankfully at least my Pure Performance file topped out by a decent margin, so hopefully less chance I'll be seen as just being a sour puss.
I guess I'll start by saying now it can be seen that I wasn't just making up the numbers in my own comparison test, where the results were Pure Performance 6.5, Premier League 1.0 7.333, and Orion's weights 13.166. You can see the results are similar, particularly if you look at the individual samples (I didn't do as many samples).
Now, my critiques:
I'll start with an intuitive example. In keithb's file Maeda is rank 102 for FS, and in Premier League 2.1 he is rank 17. Regardless of which file you assume is better, if you were assessing based on this player alone there would be obviously be a great difference. The thing is, these exceptions to the rule constitute a minority of players, and so if you're picking a full squad, half are going to be identical players, and many of the rest are going to be minor differences like Mbappe vs. Haaland. In fact, it's a surprise there's any significant difference at all between HarvestGreen's/Orion's weights and Pure Performance for this reason.
Now if you're on board with that, then let's take it to the next matter. Because now I'm going to show that those exceptions matter, and I would argue you can't really just conclude 'well, if they're all about the same once you buy a full squad, who cares'.
Suppose I want a top striker for my team. I load up keithb's ratings, sort by FS, and find that the cheapest of the top 20 is Victor Gyokeres for a GS estimated sale value of £100mil. If I use Premier League 1.0, in the top 20 I have Furuhashi (£33.8mil), Maeda (£22.4mil), Jhon Cordoba (£8.5mil) and even a few more under the cheapest in keithb's ratings. If I load up FM24 now as Fulham and make an offer for Gyokeres, they want £41.5mil, whereas for Maeda it's £12.5mil, so it's not just GS. Pure Performance also has this problem, although to a lesser extent than keithb's file - the cheapest in the top 20 FS is Umar Sadiq for £40mil sale value (~£20mil in game).
Now who would argue money is no matter in FM?
So one thing I'm interested in seeing in your save, is the relative cost/value of each squad. I don't actually know if Premier League 2.1 would be significantly less expensive to purchase, but I suspect it would be.
Now the matter of performance. I have high confidence that Premier League 2.1 is going to give more accurate performance estimations than Pure Performance. I am confident because I have tested a player like Maeda, and I know with certainty he gets the team to 3rd, so he's definitely up there with the best. So how then does it finish worse here? Because these files should be comparing by performance alone, not cost - the low cost would just be a symptom of the improved efficiency.
I can think of a few possibilities here, but I'll just say the main two.
You 'froze' and 'healed' the players. Two of the biggest factors in Premier League 2.1 are dirtiness and injury proneness. If you prevent red cards, injuries, and so on, then you'd be disrupting a key part of the natural process. But I'm not sure exactly what the freeze/healing extends to.
The second thing is that while the goal of Premier League 2.1 is to assess performance rather than value, this does nonetheless loop back around.. let me demonstrate what I mean by this:
Your selections for ST are as follows:
Premier League 2.1 - Adam Zrelak, 113 CA, £2k/week, Warta Poznań (Poland Div 1)
Keithb - Alexis Sanchez, 137 CA, £78k/wk, Inter Milan
Pure Performance - Jair Silva, 112 CA, £1.2k/week, Leiria (Portugal Div 2)
Orion - Choupo-Moting, 137 CA, £123k/wk, FC Bayern
HarvestGreen - Dickson Abiama, 110 CA, £10k/wk, FC Kaiserslautern
If I've thought about this right, what is going on here is a problem with the methodology where because the better players are actually getting pushed up in Premier League 2.1 (i.e. Maeda 102 -> 16) this leaves what's left down at player 102 slightly weaker and yet still adequate, while also being more populated by even lower CA players who have been pushed up (i.e. Zrelak 300 > 100 say).
To complicate matters, this would only affect a minority of players, because people like Maeda and Zrelak are the exceptions not the rule, and for that majority remainder most of them are going to be the same selections (overlap) while one or two (differences) may even be better than Premier League 2.1. So for example if you selected players at rank 102, guess what, keithb gets Maeda and Premier League 2.1 gets someone like Zrelak. But actually Alexis Sanchez is higher rated in keithb's file than in Premier League 2.1. So it's overall its like I got Maeda/Kuruhashi/Cordoba right and Sanchez wrong, while keithb gets Maeda/Kuruhashi/Cordoba wrong, but gets Sanchez right. But you tell me what you think of this theory.
To put it another way, the file that would finish 1st in your test would have Haaland, Mbappe, etc. at the rank of 300 or whatever it is that you are selecting at. However it does nonetheless have use, because it tells us how many duds are pulling the team down. For example, keithb's team has an ST from Inter Milan, yet why does it still get beaten by Pure Performance on average? I reckon if we have a look at the file, Sanchez will get 7.3+ rating, but a few duds will get 6.5. Just my guess.
I guess I should clarify one thing a bit more.
Suppose we have that situation where a file makes Haaland rank 300. How do we actually tell Haaland from Joe Blow from Slough, in that case? How can we say that file is 'wrong', when it actually 'performs' better?
The answer is we look at his value. This is why value matters, even for assessing pure performance. Because once we see Haaland's £300mil asking price, compare it to our £18,582 transfer budget, we quickly move on to the player below him - who is Joe Blow from Slough.
Keep in mind it's not at all saying that higher value = strictly better performance. What I'm instead saying is that if a player has a significantly higher value, it's highly unlikely that he is going to be worse. It's like if I buy a $200 toaster. Is it going to be worse than the old cheap one? Probably not. Is it going to toast better? Not necessarily.
The fundamental basis for this is CA vs attribute imbalance. Very old players have the worst imbalances (i.e. Dybala - ~9 physical, ~18 mental/technical) and often high rep, and therefore generally the worst over-valuations. Dybala is valued at £10mil. Now there are a few players who are significantly better for the same price or less, such as Maeda, but it's a minority. Now try the inverse, find me a player who is low value but very highly rated. Again, it's a minority.
Now you might say, well if value is such a reliable correlation, why not rely on that alone? The answer is that those players with £300mil valuations, even though they make up the majority of the top players, are useless to us. We are looking for the diamonds in the rough, even if we 'just want the best performing players right now', because you need to pay to get them! Hence valuations are an important/useful measurement for telling Haaland from Joe Blow, but NOT for ranking utility, and even if you did have the billions to spend, valuation does an inadequate job of distinguishing exceptions to the rule. It is an assessment and therefore indicator of quality itself rather than a contributor to quality, and so it can be used to critique a ranking but not determine it. In fact we want our ranking system to find as many exceptions to the valuation ranking as possible, so long as they are valid.
bf3metro said: Acceleration: 18.1, Pace: 18.8, JumpingReach: 8.6, Pressure: 3.4, Dribbling: 2.86, WorkRate: 13.3, Agility: 3.2, Anticipation: 8, Composure: 5.2, Stamina: 10, Consistency: 2.81, Determination: 8.7, Balance: 2.85, Strength: 1, Concentration: 9, Finishing: 0.4, ImportantMatches: 2.02, NaturalFitness: 1.29, Professionalism: 3, Ambition: 0.4, Loyalty: 0.2, Aggression: 2, Vision: 0.1,
AerialReach: 5.736, CommandOfArea: 3.138, FirstTouch: 3.398, Passing: 2.092, Reflexes: 17.2, Concentration: 16.47, Determination: 17.778, WorkRate: 7.736, Acceleration: 3.006, Balance: 2.092, Agility: 6.536, JumpingReach: 2.86, NaturalFitness: 2.092, Pace: 5.66, Stamina: 6.536, Strength: 2.092, Technique: 3.138, Pressure: 3.006, Professionalism: 1.96, Flair: 9.804, Vision: 5,
what do you think of that? i think it translates better FMST to FMSS.
@GeorgeFloydOverdosed
Your translation isn’t wrong at all — I think we’re just optimizing for two slightly different things.
Your method normalizes the coefficients so the strongest attribute weight becomes 20, which makes a lot of sense if the goal is to express the weights themselves on an FM-style 1–20 scale.
For mine, I used GPT-5.6’s reasoning to preserve the full FMST formula as literally as possible and translate the final FMST score onto FMSS’s 1–20 scale.
The main difference is that I use the same ÷5 conversion for both outfield and GK, because that gives:
FMSS Meta = FMST score ÷ 5
So 100 → 20, 90 → 18, 75 → 15, etc.
That also means GK and outfield remain on exactly the same scale. With the “highest coefficient = 20” approach, outfield ends up using roughly ÷4.7 while GK uses roughly ÷4.4445, so the two formulas are normalized slightly differently.
I also kept every FMST term that FMSS can access, including hidden/personality attributes, the CA penalty for GKs, and the original nonlinear Injury Proneness and Dirtiness calculations rather than simplifying them into fixed weights.
So I definitely wouldn’t call your version wrong — it’s a good normalized/simplified implementation. I just think the GPT-5.6 version is more faithful if the objective is specifically to port the complete FMST calculation into FMSS while keeping the output on a consistent 1–20 scale.
If you want, I can send/upload the exact code I’m using so you can compare the implementations directly.
bf3metro said: @GeorgeFloydOverdosed
Your translation isn’t wrong at all — I think we’re just optimizing for two slightly different things.
Your method normalizes the coefficients so the strongest attribute weight becomes 20, which makes a lot of sense if the goal is to express the weights themselves on an FM-style 1–20 scale.
For mine, I used GPT-5.6’s reasoning to preserve the full FMST formula as literally as possible and translate the final FMST score onto FMSS’s 1–20 scale.
The main difference is that I use the same ÷5 conversion for both outfield and GK, because that gives:
FMSS Meta = FMST score ÷ 5
So 100 → 20, 90 → 18, 75 → 15, etc.
That also means GK and outfield remain on exactly the same scale. With the “highest coefficient = 20” approach, outfield ends up using roughly ÷4.7 while GK uses roughly ÷4.4445, so the two formulas are normalized slightly differently.
I also kept every FMST term that FMSS can access, including hidden/personality attributes, the CA penalty for GKs, and the original nonlinear Injury Proneness and Dirtiness calculations rather than simplifying them into fixed weights.
So I definitely wouldn’t call your version wrong — it’s a good normalized/simplified implementation. I just think the GPT-5.6 version is more faithful if the objective is specifically to port the complete FMST calculation into FMSS while keeping the output on a consistent 1–20 scale.
If you want, I can send/upload the exact code I’m using so you can compare the implementations directly.
With your formula, the problem is that it uses too many attributes. For some reason, FMSS will fail with all of them included. At least it did for me.
Normalizing them however you like is fine though
GeorgeFloydOverdosed said: If you don't mind, I would like that save file, to have a closer look at it.
So one thing I'm interested in seeing in your save, is the relative cost/value of each squad. I don't actually know if Premier League 2.1 would be significantly less expensive to purchase, but I suspect it would be.
I mentioned this before, but forgot to add it to the post. Everyone was £1 million sale value or lower on Genie Scout. I tried to use FMST specifically for your 2.1 file but was tough to do considering you can't filter by sale value and that program just constantly freezes for me. I'm sure this test has a lot of rng, but it was more so for myself to see if there's even a big difference at this point. Made me feel better about using the blended and pure performance the most when buying players I guess. I didn't really take a close look at stats, but when I did look it seemed Zrelak was doing really well. I uploaded the save file to that google drive folder.
Rain said: I mentioned this before, but forgot to add it to the post. Everyone was £1 million sale value or lower on Genie Scout. I tried to use FMST specifically for your 2.1 file but was tough to do considering you can't filter by sale value and that program just constantly freezes for me. I'm sure this test has a lot of rng, but it was more so for myself to see if there's even a big difference at this point. Made me feel better about using the blended and pure performance the most when buying players I guess. I didn't really take a close look at stats, but when I did look it seemed Zrelak was doing really well. I uploaded the save file to that google drive folder.
I was wrong about the transfer value theory. I realized this as I was creating my own my test afterwards, saw the overlap in players I myself was selecting, and remembered the 1mil limit you mentioned. My mind saw the high wages and went straight to transfer value.
I thought that nonetheless, wage is kind of a similar measurement.. particularly for older players, who have low value to advantaged age and short contracts.
But after conducting my own test, I am getting about the same results, even with my refinements that I feel do it better. My refinements are that I select just one player for each position but duplicate 3-4 times, I get my choices first by exporting shortlist from FM24 for Luton where interest is at least 'doubtful', then I choose one of the top 4 or 5 who has the lowest value, and I play it out as a normal game (meta training, friendlies, etc.) and I'm testing one team at a time (replaced the roster at Luton).
My results so far are:
Premier League 2.1 - 10th, 9th, 11th = 10 position
Keithb - 11th, 11th, 16th, 13th = 12.75 position
keithb:
GK - Edgar Badia 79.1%
DL - Hamza Mendyl 69.9%
DC - Kim Min Tae 72.4%
DR - Jusuf Gazibegovic 72.1%
DM - Gaius Makouta 73.5%
AML - Michael (Al-Hilal) 70.3%
AMR - Jacob Murphy 74.8%
ST - Jhon Cordoba 77.4%
Premier League 2.1:
GK - Edgar Badia 79.1%
DL - Jesus Gallardo 72.6%
DC - Kim Min Tae 72.4%
DR - Wajdi Kechrida 74.1%
DM - Aliou Dieng 74.8%
AML - Zakaria Aboukhlal 73.2%
AMR - Jacob Murphy 74.8%
ST - Jhon Cordoba 77.4%
% is my FMST26 rating. So there's a ~2% difference on 5/11 of the team.
I'm currently testing a new idea that occurred to me after this, which is what if I take keithb's top players that my rating says are rubbish - so the biggest discrepancies - and then test a team of those. So we'll see what that difference is.
Of course, ordinarily one would not happen to pick all the bad eggs in keithb's file; the difference in normal use remains ~2.75 positions according to my test, or a marginal difference according to yours.
Before when you were doing your test, I also manually had a go at wiping Luton and buying the best players I could with a £10mil budget. So basically actually playing the game to see the best I could actually sign as the lowest and impoverished Premier League team. Honestly I expected I would get 1st, but actually I only achieved 8th.
I hadn't thought about just duplicating the starters that's a good idea. I just wouldn't want them to end up playing alongside eachother in the starting 11. If I was smarter I would have came up with a way to automate the whole process, but I figured in the end it probably didn't make much difference to what I already knew.
I think what I've learned recently is when buying young players I might just start using all the weights except Pace/Accel and just set a minimum there knowing I can train that up pretty easily before they actually end up playing for me.
GeorgeFloydOverdosed said: With your formula, the problem is that it uses too many attributes. For some reason, FMSS will fail with all of them included. At least it did for me.
Normalizing them however you like is fine though
That makes sense if you actually ran into a limitation in your build.
From the app.js I’m using though, GPT-5.6 checked the scoring path and there doesn’t seem to be a hard attribute-count limit there — it just loops through the weights that are defined and skips values that aren’t available. So the issue you ran into might be somewhere else in the FMSS pipeline/version rather than the Meta calculation itself.
Looking at our two versions side by side, I also think the main difference isn’t really 4.7 vs 5. For the attributes we both include, the relative weighting is basically the same — yours is normalized so Pace = 20, while mine uses ÷5 so the final FMST score translates consistently onto FMSS’s 1–20 scale.
The bigger difference is completeness. Mine keeps more of the original FMST formula wherever FMSS exposes the data: Consistency, Important Matches, Professionalism, Natural Fitness, Aggression, etc. It also keeps the original Injury Proneness and Dirtiness interactions rather than simplifying them into fixed weights.
So I’d describe yours as a more compact/simplified FMST implementation, while mine is trying to be a more literal port of the full formula.
If the full version really does cause problems in certain FMSS builds, then your reduced version obviously makes sense for robustness. Mine is currently running fine with the full set though, so if you want I can send you my app.js and maybe you can spot what caused the limitation on your side.
bf3metro said: That makes sense if you actually ran into a limitation in your build.
From the app.js I’m using though, GPT-5.6 checked the scoring path and there doesn’t seem to be a hard attribute-count limit there — it just loops through the weights that are defined and skips values that aren’t available. So the issue you ran into might be somewhere else in the FMSS pipeline/version rather than the Meta calculation itself.
Looking at our two versions side by side, I also think the main difference isn’t really 4.7 vs 5. For the attributes we both include, the relative weighting is basically the same — yours is normalized so Pace = 20, while mine uses ÷5 so the final FMST score translates consistently onto FMSS’s 1–20 scale.
The bigger difference is completeness. Mine keeps more of the original FMST formula wherever FMSS exposes the data: Consistency, Important Matches, Professionalism, Natural Fitness, Aggression, etc. It also keeps the original Injury Proneness and Dirtiness interactions rather than simplifying them into fixed weights.
So I’d describe yours as a more compact/simplified FMST implementation, while mine is trying to be a more literal port of the full formula.
If the full version really does cause problems in certain FMSS builds, then your reduced version obviously makes sense for robustness. Mine is currently running fine with the full set though, so if you want I can send you my app.js and maybe you can spot what caused the limitation on your side.
const META_W = {
Acceleration: 18.1, Pace: 18.8, JumpingReach: 8.6, Pressure: 3.4, Dribbling: 2.86,
WorkRate: 13.3, Agility: 3.2, Anticipation: 8, Composure: 5.2, Stamina: 10,
Consistency: 2.81, Determination: 8.7, Balance: 2.85, Strength: 1,
Concentration: 9, Finishing: 0.4, ImportantMatches: 2.02, NaturalFitness: 1.29,
Professionalism: 3, Ambition: 0.4, Loyalty: 0.2, Aggression: 2, Vision: 0.1,
};
const META_GK_W = {
AerialReach: 5.736, CommandOfArea: 3.138, FirstTouch: 3.398, Passing: 2.092,
Reflexes: 17.2, Concentration: 16.47, Determination: 17.778, WorkRate: 7.736,
Acceleration: 3.006, Balance: 2.092, Agility: 6.536, JumpingReach: 2.86,
NaturalFitness: 2.092, Pace: 5.66, Stamina: 6.536, Strength: 2.092,
Technique: 3.138, Pressure: 3.006, Professionalism: 1.96, Flair: 9.804,
Vision: 5,
};
edit: I tested it properly on my current build. I ran the full weightedMeta() directly, uncached, across 94,111 players using all 23 outfield weights and 21 GK weights. It completed in ~74 ms with 0 errors and 0 invalid scores. I also checked for missing attributes and got none, and PA-Meta passed all 94,111 players too. So whatever attribute-count limitation you ran into doesn’t seem to reproduce on my current FMSS version. Maybe it was related to an older build/plugin or a different part of the data pipeline.
bf3metro said: const META_W = {
Acceleration: 18.1, Pace: 18.8, JumpingReach: 8.6, Pressure: 3.4, Dribbling: 2.86,
WorkRate: 13.3, Agility: 3.2, Anticipation: 8, Composure: 5.2, Stamina: 10,
Consistency: 2.81, Determination: 8.7, Balance: 2.85, Strength: 1,
Concentration: 9, Finishing: 0.4, ImportantMatches: 2.02, NaturalFitness: 1.29,
Professionalism: 3, Ambition: 0.4, Loyalty: 0.2, Aggression: 2, Vision: 0.1,
};
const META_GK_W = {
AerialReach: 5.736, CommandOfArea: 3.138, FirstTouch: 3.398, Passing: 2.092,
Reflexes: 17.2, Concentration: 16.47, Determination: 17.778, WorkRate: 7.736,
Acceleration: 3.006, Balance: 2.092, Agility: 6.536, JumpingReach: 2.86,
NaturalFitness: 2.092, Pace: 5.66, Stamina: 6.536, Strength: 2.092,
Technique: 3.138, Pressure: 3.006, Professionalism: 1.96, Flair: 9.804,
Vision: 5,
};
edit: I tested it properly on my current build. I ran the full weightedMeta() directly, uncached, across 94,111 players using all 23 outfield weights and 21 GK weights. It completed in ~74 ms with 0 errors and 0 invalid scores. I also checked for missing attributes and got none, and PA-Meta passed all 94,111 players too. So whatever attribute-count limitation you ran into doesn’t seem to reproduce on my current FMSS version. Maybe it was related to an older build/plugin or a different part of the data pipeline.
I cannot copy paste this format in FMST, can you help me with that?
FMLeandro said: I cannot copy paste this format in FMST, can you help me with that?
that's FMSS.
bf3metro said: So whatever attribute-count limitation you ran into doesn’t seem to reproduce on my current FMSS version. Maybe it was related to an older build/plugin or a different part of the data pipeline.
I figured it could be this. I'm using the latest version I believe. I'll try doing a reinstall later on.
You've got it working, and anyone who uses FMSS can use your weights.
Trying to debug code frustrates the hell out of me. I don't know how people willingly do it every day for a living. I've also found it tedious translating the FMST26 weights to GS.
I'm not quite satisfied with the GS weights, especially in light of Rain's recent test, and the 15% discrepancy rate between the FMST26 and GS weights. I want my weights to perform at least slightly better in every respect than anything else ideally. I give 8/10 now though.
I guess Rain's finding that there isn't too much difference overall between different weightings makes sense when you do the math on it.
5/11 players @ +2% = +10% for +2.75 position = +0.55 position per player @ +2%
Maeda (83%) 3.0 vs. Dybala (69%) 6.4 = +14% for +3.4 position
+10% for +2.75 position = +3.63% for +1 position
+14% for +3.4 position = +4.11% for +1 position
Could be just a coincidental correlation, but I reckon it's probably reflecting a consistent effect. The 80%/78%/76%/74% team test does suggest that the % differences can be simplified to addition, as there were strong distinctions in the results.
I'm putting my comparison test of keithb's biggest discrepancies with Premier League 2.1 on hold for now, but if we just take Maeda vs. Heung-Min Son for a quick picture, there's a ~8.9% discrepancy. Let's say in a worst case scenario you sign 4 of your starting 11 as these discrepancies:
8.9% x 4 = 35.6%
If ~4% ≈ 1 position, then 35.6% = 8.9 position
So the most difference you could get from keithb or GS default weights say and mine, or whatever is best, is probably 9th vs 18th.
If we suppose the chance of a Maeda-like discrepancy (+ the curve leading up to Maeda) is ~8% total, then:
1/11 discrepancy ≈ 39.4% chance of -2.22 position
2/11 discrepancy ≈ 17.3% chance of -4.45 position
3/11 discrepancy ≈ 4.6% chance of -6.67 position
4/11 discrepancy ≈ 0.82% chance of -8.9 position
That is to be added on top of the common ~2% difference in ratings.
So let's say its a realistic worst case scenario where its 2x Maeda + 3x identical + 6x the typical ~2% difference:
~15% chance, with result of -7.45 position (i.e. 9 vs 16.45 position)
GeorgeFloydOverdosed said: I figured it could be this. I'm using the latest version I believe. I'll try doing a reinstall later on.
You've got it working, and anyone who uses FMSS can use your weights.
Trying to debug code frustrates the hell out of me. I don't know how people willingly do it every day for a living. I've also found it tedious translating the FMST26 weights to GS.
I'm not quite satisfied with the GS weights, especially in light of Rain's recent test, and the 15% discrepancy rate between the FMST26 and GS weights. I want my weights to perform at least slightly better in every respect than anything else ideally. I give 8/10 now though.
I guess Rain's finding that there isn't too much difference overall between different weightings makes sense when you do the math on it.
5/11 players @ +2% = +10% for +2.75 position = +0.55 position per player @ +2%
Maeda (83%) 3.0 vs. Dybala (69%) 6.4 = +14% for +3.4 position
+10% for +2.75 position = +3.63% for +1 position
+14% for +3.4 position = +4.11% for +1 position
Could be just a coincidental correlation, but I reckon it's probably reflecting a consistent effect. The 80%/78%/76%/74% team test does suggest that the % differences can be simplified to addition, as there were strong distinctions in the results.
I'm putting my comparison test of keithb's biggest discrepancies with Premier League 2.1 on hold for now, but if we just take Maeda vs. Heung-Min Son for a quick picture, there's a ~8.9% discrepancy. Let's say in a worst case scenario you sign 4 of your starting 11 as these discrepancies:
8.9% x 4 = 35.6%
If ~4% ≈ 1 position, then 35.6% = 8.9 position
So the most difference you could get from keithb or GS default weights say and mine, or whatever is best, is probably 9th vs 18th.
If we suppose the chance of a Maeda-like discrepancy (+ the curve leading up to Maeda) is ~8% total, then:
1/11 discrepancy ≈ 39.4% chance of -2.22 position
2/11 discrepancy ≈ 17.3% chance of -4.45 position
3/11 discrepancy ≈ 4.6% chance of -6.67 position
4/11 discrepancy ≈ 0.82% chance of -8.9 position
That is to be added on top of the common ~2% difference in ratings.
So let's say its a realistic worst case scenario where its 2x Maeda + 3x identical + 6x the typical ~2% difference:
~15% chance, with result of -7.45 position (i.e. 9 vs 16.45 position)
I really like the work you’ve done with all of this. You’re basically the pivotal part of it — I’ve only translated/adapted what you already built into FMST. The testing, comparisons and all the work you’ve put into the weights are the reason there’s something solid to translate in the first place.
I’m really looking forward to whatever updates you make next, especially if you keep refining the GS weights after Rain’s latest testing. And I genuinely hope you’ll still be around doing this for FM27 as well — it would feel weird going into a new FM without your testing and weight work to build from 😅
On the differences between weighting systems, what you’re saying makes sense to me. The average difference might be relatively small, but I think the important cases are the outliers where one system values a player very differently from another.
If Maeda-type discrepancies are relatively rare, most squads probably won’t be massively affected, but getting even 2–3 of those decisions wrong in the same XI could still create a pretty meaningful performance difference.
The ~4% ≈ 1 league position relationship looks surprisingly consistent from the examples you’ve got. I’d probably still treat it as an empirical approximation rather than something perfectly linear, but there definitely seems to be something there.
And yeah, the FMSS translation seems completely fine on my side now. I stress-tested the full weights across my database and it runs with no missing attributes or calculation errors, so if you or anyone else wants to use/share the FMSS weights, absolutely feel free.
I've re-examined training according to what matters in the Premier League 2.1 weights, for both outfield and GK.
This time I was able to calculate everything quickly and comprehensively utilizing ChatGPT with HarvestGreen's excel sheets.
I haven't calculated every schedule exhaustively, just the ones you see here, most of which were the most promising previously.
Overall I recommend either 260 [Physical][Match Practice][Attacking]x2[Quickness Focus] for squad with high CA-PA gap or 156 [Physical][Quickness][Transition Restrict][Quickness Focus] with low CA-PA gap. Or 214 [Physical]x2[Attacking]x2[Quickness Focus] for something inbetween.
Weighted attribute improvement:
260: [Physical][Match Practice][Attacking]x2 = 1156.35
142: [Physical][Quickness][Attacking]x3 = 1135.2835
212: 2x Physical + 2x Match Practice + Attack + Defend + Set Pieces = 1126.97
97: [Chance creation][Attacking][Aerial Defense][Handling][Defending from front][Quickness][Quick focus] = 1122.54
338: [Physical][Match Practice][Attacking][Defending][Recovery]x7[Quickness Focus] = 1117.508
214: [Physical]x2[Attacking]x2[Quickness Focus] = 1115.573
149: [Match Practice][Attacking][Match Tactics]x2[Tactical]x2 = 1101.13
139: [Physical][Quickness][Resistance][Defending] = 1091.794
339: [Quickness][Attacking][Match Practice] = 1086.43
243: [Quickness][Match Practice[Attackingx2][Quickness focus] = 1079.689
150: [Attackingx6][Quickness focus] = 1079.6675
334: [Physical]x2[Aerial Defence][Attacking] = 1078.23
90: [Attacking]x3 = 1061.16
466: [Quickness][Physical][Attacking] Additional focus: Ball Control = 1056.47
147: [Attacking][Match Tactics]x3 = 1046.77
164: [Physical][Quickness][Aerial Defence]x2[Match Review] = 1039.84
166: [Resistance][Quickness][Chance Conversion] = 1028.64
156: [Physical][Quickness][Transition Restrict] = 1026.7215
331: [Physical][Match Practice][Attacking][Defending] = 1020.63
160: [Physical][Quickness][Resistance][Transition Restrict]x2 = 1018.89
148: [Attacking][Match Tactics]x3[Tactical]x2 = 1011.46
327: [Quickness][Match Practice][Attacking]x2[Strength Focus] = 1005.93
116: [Physical]x2[Chance Conversion] = 1001.58
65: [Chance Creation] = 1000.90
53: [Match Practice] = 992.97
170: [Endurance][Quickness][Chance Conversion] = 962.78
123: [Quickness][Attacking][Transition Restrict] = 958.12
106: [Quickness][Attacking][Overall] = 948.62
83: [Community Outreach] = 940.47
113: [Quickness][Match Practice][Chance Conversion][Quickness focus] = 927.185
161: [Physical][Quickness][Aerial Defence][Recovery]x7 = 916.81
75: [One on Ones] = 910.01
54: [Attacking Wings] = 907.79
55: [Attacking Patient] = 891.86
99: [Chance Conversion][Match Review] = 848.14
168: [Quickness]x2[Chance Conversion] = 838.56
86: [Rest]Quickness Focus] = 792.26
43: [Rest][No Focus] = 735.1305
Weighted attribute improvement divided by CA cost:
86: [Rest]Quickness Focus] = 792.26 / 17.53 = 45.194
43: [Rest][No Focus] = 735.1305 / 16.85 = 43.628
156: [Physical][Quickness][Transition Restrict] = 1026.7215 / 24.20 = 42.42
166: [Resistance][Quickness][Chance Conversion] = 1028.64 / 25.71 = 40.010
65: [Chance Creation] = 1000.90 / 25.80 = 38.794
139: [Physical][Quickness][Resistance][Defending] = 1091.794 / 28.71 = 38.027
466: [Quickness][Physical][Attacking] Additional focus: Ball Control = 1056.47 / 29.00 = 36.430
334: [Physical]x2[Aerial Defence][Attacking] = 1078.23 / 31.21 = 34.545
214: [Physical]x2[Attacking]x2[Quickness Focus] = 1115.573 / 33.83 = 32.973
338: [Physical][Match Practice][Attacking][Defending][Recovery]x7[Quickness Focus] = 1117.508 / 34.99 = 31.939
212: 2x Physical + 2x Match Practice + Attack + Defend + Set Pieces = 1126.97 / 35.78 = 31.495
142: [Physical][Quickness][Attacking]x3 = 1135.2835 / 36.43 = 31.164
149: [Match Practice][Attacking][Match Tactics]x2[Tactical]x2 = 1101.13 / 35.50 = 31.017
97: [Chance creation][Attacking][Aerial Defense][Handling][Defending from front][Quickness][Quick focus] = 1122.54 / 36.48 = 30.771
339: [Quickness][Attacking][Match Practice] = 1086.43 / 35.72 = 30.416
90: [Attacking]x3 = 1061.16 / 34.98 = 30.335
150: [Attackingx6][Quickness focus] = 1079.6675 / 36.20 = 29.825
260: [Physical][Match Practice][Attacking]x2 = 1156.35 / 38.98 = 29.664
243: [Quickness][Match Practice[Attackingx2][Quickness focus] = 1079.689 / 37.93 = 28.460
331: [Physical][Match Practice][Attacking][Defending] = 1020.63 / 39.62 = 25.759
GK:
142: [Physical][Quickness][Attacking]x3 = 1048.42
260: [Physical][Match Practice][Attacking]x2 = 965.23
214: [Physical]x2[Attacking]x2[Quickness Focus] = 805.20
156: [Physical][Quickness][Transition Restrict] = 717.03
139: [Physical][Quickness][Resistance][Defending] = 662.44
243: [Quickness][Match Practice[Attackingx2][Quickness focus] = 614.57
86: [Rest][Quickness Focus] = 310.616
43: [Rest][No Focus] = 282.70
10x outfield + 1x GK:
260: [Physical][Match Practice][Attacking]x2 = 1138.975
142: [Physical][Quickness][Attacking]x3 = 1127.386
214: [Physical]x2[Attacking]x2[Quickness Focus] = 1087.357
139: [Physical][Quickness][Resistance][Defending] = 1052.762
243: [Quickness][Match Practice[Attackingx2][Quickness focus] = 1037.405
156: [Physical][Quickness][Transition Restrict] = 998.567
86: [Rest][Quickness Focus] = 748.474
43: [Rest][No Focus] = 694.000
Workload:
156: [Physical][Quickness][Transition Restrict] = 95%
260: [Physical][Match Practice][Attacking]x2 = 100%
214: [Physical]x2[Attacking]x2 = 105%
243: [Quickness][Match Practice[Attackingx2][Quickness focus] = 120%
142: [Physical][Quickness][Attacking]x3 = 125%
139: [Physical][Quickness][Resistance][Defending] = 135%
Notes:
Green = The new best training schedules, in my opinion
Light blue = The two schedules I have last recommended. They're both still worth considering.
Deep blue = ZaZ's recommended schedule
Pink = A long time popular meta
Purple = HarvestGreen's last recommendation
Where no focus is listed, it's Quickness Focus.
Workload will be a little inaccurate, as I eyeballed the intensity bars rather than calculated it.
GeorgeFloydOverdosed said: I've re-examined training according to what matters in the Premier League 2.1 weights, for both outfield and GK.
This time I was able to calculate everything quickly and comprehensively utilizing ChatGPT with HarvestGreen's excel sheets.
I haven't calculated every schedule exhaustively, just the ones you see here, most of which were the most promising previously.
Overall I recommend either 260 [Physical][Match Practice][Attacking]x2[Quickness Focus] for squad with high CA-PA gap or 156 [Physical][Quickness][Transition Restrict][Quickness Focus] with low CA-PA gap. Or 214 [Physical]x2[Attacking]x2[Quickness Focus] for something inbetween.
Weighted attribute improvement:
260: [Physical][Match Practice][Attacking]x2 = 1156.35
142: [Physical][Quickness][Attacking]x3 = 1135.2835
212: 2x Physical + 2x Match Practice + Attack + Defend + Set Pieces = 1126.97
338: [Physical][Match Practice][Attacking][Defending][Recovery]x7[Quickness Focus] = 1117.508
214: [Physical]x2[Attacking]x2[Quickness Focus] = 1115.573
149: [Match Practice][Attacking][Match Tactics]x2[Tactical]x2 = 1101.13
139: [Physical][Quickness][Resistance][Defending] = 1091.794
339: [Quickness][Attacking][Match Practice] = 1086.43
243: [Quickness][Match Practice[Attackingx2][Quickness focus] = 1079.689
150: [Attackingx6][Quickness focus] = 1079.6675
334: [Physical]x2[Aerial Defence][Attacking] = 1078.23
90: [Attacking]x3 = 1061.16
466: [Quickness][Physical][Attacking] Additional focus: Ball Control = 1056.47
147: [Attacking][Match Tactics]x3 = 1046.77
164: [Physical][Quickness][Aerial Defence]x2[Match Review] = 1039.84
97: [Chance creation][Attacking][Aerial Defense][Handling][Defending from front][Quickness][Quick focus] = 1039.29
166: [Resistance][Quickness][Chance Conversion] = 1028.64
156: [Physical][Quickness][Transition Restrict] = 1026.7215
331: [Physical][Match Practice][Attacking][Defending] = 1020.63
160: [Physical][Quickness][Resistance][Transition Restrict]x2 = 1018.89
148: [Attacking][Match Tactics]x3[Tactical]x2 = 1011.46
327: [Quickness][Match Practice][Attacking]x2[Strength Focus] = 1005.93
116: [Physical]x2[Chance Conversion] = 1001.58
65: [Chance Creation] = 1000.90
53: [Match Practice] = 992.97
170: [Endurance][Quickness][Chance Conversion] = 962.78
123: [Quickness][Attacking][Transition Restrict] = 958.12
106: [Quickness][Attacking][Overall] = 948.62
83: [Community Outreach] = 940.47
113: [Quickness][Match Practice][Chance Conversion][Quickness focus] = 927.185
161: [Physical][Quickness][Aerial Defence][Recovery]x7 = 916.81
75: [One on Ones] = 910.01
54: [Attacking Wings] = 907.79
55: [Attacking Patient] = 891.86
99: [Chance Conversion][Match Review] = 848.14
168: [Quickness]x2[Chance Conversion] = 838.56
86: [Rest]Quickness Focus] = 792.26
43: [Rest][No Focus] = 735.1305
Weighted attribute improvement divided by CA cost:
86: [Rest]Quickness Focus] = 792.26 / 17.53 = 45.194
43: [Rest][No Focus] = 735.1305 / 16.85 = 43.628
156: [Physical][Quickness][Transition Restrict] = 1026.7215 / 24.20 = 42.42
166: [Resistance][Quickness][Chance Conversion] = 1028.64 / 25.71 = 40.010
65: [Chance Creation] = 1000.90 / 25.80 = 38.794
139: [Physical][Quickness][Resistance][Defending] = 1091.794 / 28.71 = 38.027
466: [Quickness][Physical][Attacking] Additional focus: Ball Control = 1056.47 / 29.00 = 36.430
334: [Physical]x2[Aerial Defence][Attacking] = 1078.23 / 31.21 = 34.545
214: [Physical]x2[Attacking]x2[Quickness Focus] = 1115.573 / 33.83 = 32.973
338: [Physical][Match Practice][Attacking][Defending][Recovery]x7[Quickness Focus] = 1117.508 / 34.99 = 31.939
212: 2x Physical + 2x Match Practice + Attack + Defend + Set Pieces = 1126.97 / 35.78 = 31.495
142: [Physical][Quickness][Attacking]x3 = 1135.2835 / 36.43 = 31.164
149: [Match Practice][Attacking][Match Tactics]x2[Tactical]x2 = 1101.13 / 35.50 = 31.017
339: [Quickness][Attacking][Match Practice] = 1086.43 / 35.72 = 30.416
90: [Attacking]x3 = 1061.16 / 34.98 = 30.335
150: [Attackingx6][Quickness focus] = 1079.6675 / 36.20 = 29.825
260: [Physical][Match Practice][Attacking]x2 = 1156.35 / 38.98 = 29.664
243: [Quickness][Match Practice[Attackingx2][Quickness focus] = 1079.689 / 37.93 = 28.460
331: [Physical][Match Practice][Attacking][Defending] = 1020.63 / 39.62 = 25.759
GK:
142: [Physical][Quickness][Attacking]x3 = 1048.42
260: [Physical][Match Practice][Attacking]x2 = 965.23
214: [Physical]x2[Attacking]x2[Quickness Focus] = 805.20
156: [Physical][Quickness][Transition Restrict] = 717.03
139: [Physical][Quickness][Resistance][Defending] = 662.44
243: [Quickness][Match Practice[Attackingx2][Quickness focus] = 614.57
86: [Rest][Quickness Focus] = 310.616
43: [Rest][No Focus] = 282.70
10x outfield + 1x GK:
260: [Physical][Match Practice][Attacking]x2 = 1138.975
142: [Physical][Quickness][Attacking]x3 = 1127.386
214: [Physical]x2[Attacking]x2[Quickness Focus] = 1087.357
139: [Physical][Quickness][Resistance][Defending] = 1052.762
243: [Quickness][Match Practice[Attackingx2][Quickness focus] = 1037.405
156: [Physical][Quickness][Transition Restrict] = 998.567
86: [Rest][Quickness Focus] = 748.474
43: [Rest][No Focus] = 694.000
Workload:
156: [Physical][Quickness][Transition Restrict] = 95%
260: [Physical][Match Practice][Attacking]x2 = 100%
214: [Physical]x2[Attacking]x2 = 105%
243: [Quickness][Match Practice[Attackingx2][Quickness focus] = 120%
142: [Physical][Quickness][Attacking]x3 = 125%
139: [Physical][Quickness][Resistance][Defending] = 135%
Notes:
Green = The new best training schedules, in my opinion
Light blue = The two schedules I have last recommended. They're both still worth considering.
Deep blue = ZaZ's recommended schedule
Pink = A long time popular meta
Purple = HarvestGreen's last recommendation
Where no focus is listed, it's Quickness Focus.
Workload will be a little inaccurate, as I eyeballed the intensity bars rather than calculated it.
Hey, based on all the testing you’ve done here, do you have what you’d consider an optimal schedule to actually use week-to-week over a full season?
I’ve been using ZaZ’s Growth 2, but in my save it really isn’t delivering the development I expected.
What I’m mainly looking for is a schedule that pushes CA growth as fast as possible so players reach their PA quickly, rather than just maximizing CA efficiency.
Would you recommend switching fully to something like 260 / 214 / 156 depending on the players’ CA–PA gap, or do you have a specific weekly/monthly rotation you think is optimal in practice?
I personally like the training schedules with recovery the most, I try to keep my backup players sharpness as high as possible and recovery seems to preserve sharpness better than rest. Also I notice that for some reason the Attacking session yields an unusual number of injuries, more so than Defending or Overall. I could be wrong, but it's something I've noticed in my saves.