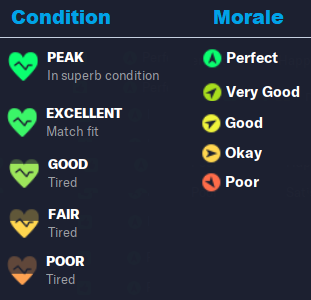
Football Manager 2023 | Condition & Morale Testing
The table below gives a good hint what effect the Condition and Morale have on the result in Football Manager 2023.
Please note, the test results have been translted into a typical season of 38 matches. We believe such "translation" gives the best gauge of the difference.
Table Legend:
PLD - Total number of matches played
PTS - Average points per 38 matches.
G.D. - Average goal difference per 38 matches.
G.F. - Average goals scored per 38 matches.
G.A. - Average conceded per 38 matches.
TACTIC
TEST DATA
WIN 46%
LOSE 54%
| PTS | GD | GF | GA | PLD |
|---|---|---|---|---|
| 53 of 114 | +3 | 73 | 70 |
2,880
|
TEST DATA
WIN 45%
LOSE 55%
| PTS | GD | GF | GA | PLD |
|---|---|---|---|---|
| 51 of 114 | 0 | 71 | 71 |
2,880
|
TACTIC
TEST DATA
WIN 41%
LOSE 59%
| PTS | GD | GF | GA | PLD |
|---|---|---|---|---|
| 47 of 114 | -4 | 69 | 73 |
2,880
|