
You are using an out of date browser. It may not display this or other websites correctly.
You should upgrade or use an alternative browser.
You should upgrade or use an alternative browser.
Vanco Corsair v35
- Thread starter vanco
- Start date
Tactic info
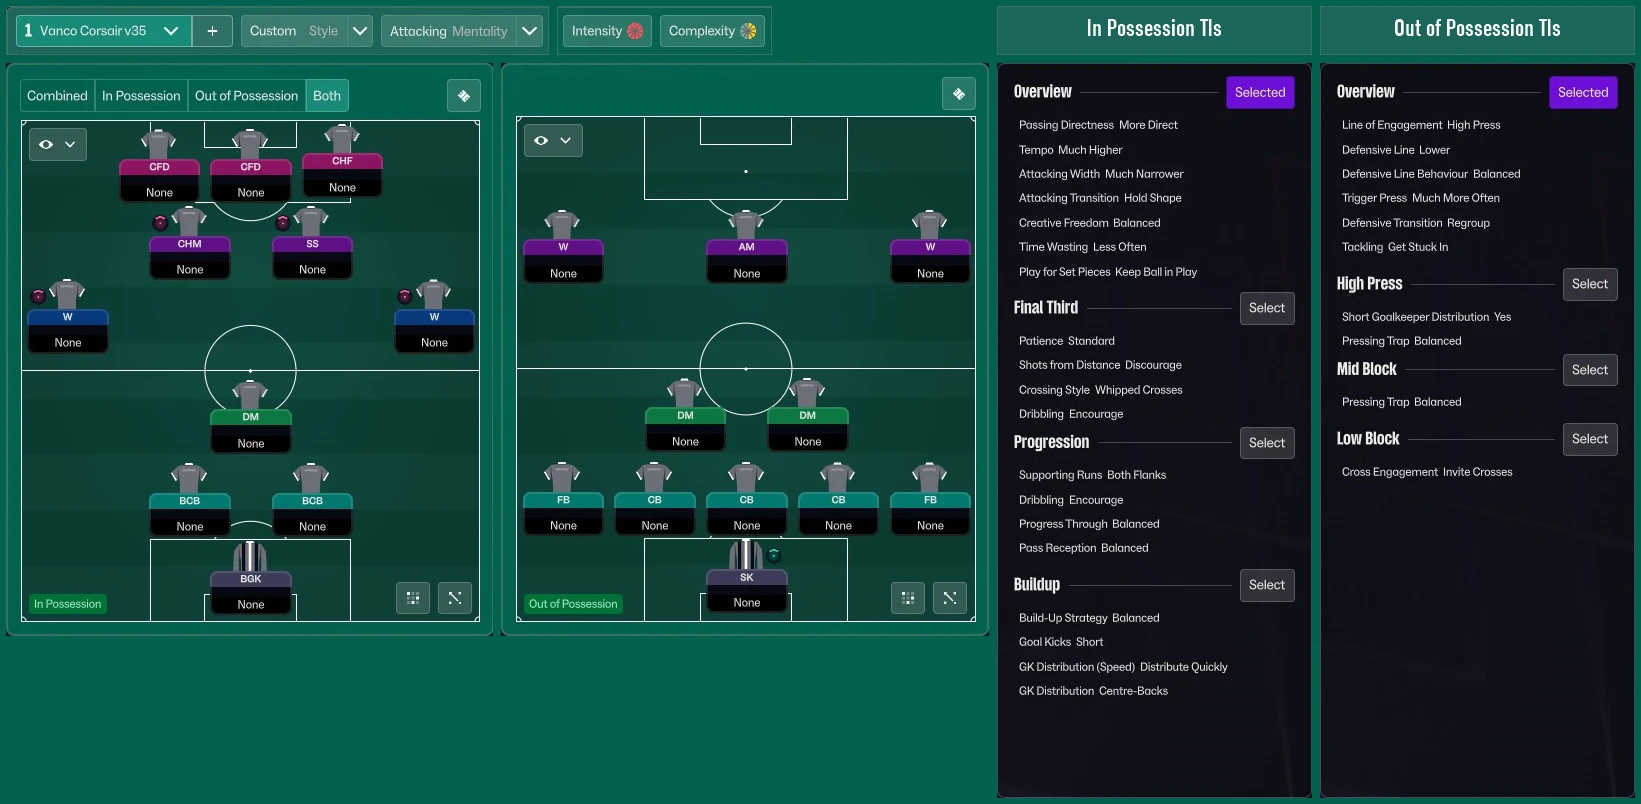
Vanco Corsair v35 - FM-Tactic-Hub
Test tactics, compare results and discuss Football Manager together.
 www.fm-helper.de
Assessment
Vanco Corsair v35 - FM-Tactic-Hub
Test tactics, compare results and discuss Football Manager together.
www.fm-helper.de
From the test program
Points/game (team-balanced) 1.740 Each team weighted equally
Goal difference/game (team-balanced) +0.597 per game
Comparison with the field
Average of 5 other tested tactics with at least 30 games; each tactic counts once.
- Strength: Against weaker opponents: 2.17 points/game (field 1.99; better than 100% of the other tactics)
- Strength: Attack: 2.35 goals/game (field 1.79; better than 100% of the other tactics)
- Weakness: Defense: 1.75 goals conceded/game (field 1.57; worse than 80% of the other tactics)
Notable findings
- Clearly dependent on squad quality Top teams 2.16 · Mid-table 1.81 · Relegation 1.26 points per game. The gap between Top teams and Relegation is 0.90 points per game; output drops markedly with weaker squads.
- Converts chances above average 2.35 goals from 2.14 xG per game (+0.20 per game). The tactic gets more from its chances than expected.
Strengths
Overall: Chance advantage xG difference +0.414 per game at 1.740 points per game. (1140 Games)- Against equal opponents: Chance advantage xG difference +0.352 per game at 1.708 points per game. (120 Games)
- Against weaker opponents: Chance advantage xG difference +0.839 per game at 2.165 points per game. (540 Games)
Weaknesses
- Relative decline away For the same team-opponent pairs: home 1.911, away 1.570 points per game (57 pairs, each pair weighted equally). This is a relative difference, not proof of its cause. (1140 Games)
Notes
- Pressing susceptibility, required player pace or role demands are not explained by these result data alone.